Table of Contents
Page created on May 17, 2020. Last updated on December 18, 2024 at 16:57
1. History and objectives of public health
- History
- Early public health interventions
- Romans diverted human waste from urban areas
- During 14th century’s Black Death, the value of quarantine was discovered
- Hippocrates: the food we eat, the place we live, the life we live affects our health
- John Snow:
- Founder of epidemiology (topic 14).
- He also challenged the miasma theory (that disease is caused by “bad air” (miasma))
- Percival Pott: Chimney sweepers develop SCC
- Edward Jenner: First vaccine (smallpox)
- Germ theory:
- Developed slowly
- John Snow’s work helped replacing the miasma theory with the germ theory
- Koch’s postulates
- The germ must be found in all diseased organisms
- The germ must be isolated and grown in culture
- The germ should cause disease in healthy organisms
- The germ must be re-isolated from diseased experiment hosts and confirmed to be the same as the original germ
- 1980: Smallpox eradicated
- Early public health interventions
- Objectives of public health
- Assess and monitor health of communities and populations at risk for disease
- Formulate health policies designed to solve health problems
- Assure that the populations have access to cost-effective and appropriate care
- Perform health promotion and disease prevention
2. Definition of health and disease
- Biomedical model = health is the freedom from disease
- Model focuses on physical processes of pathology, biochemistry, etc.
- Does not take into account social or individual factors
- Biopsychosocial model
- = Human functioning depends on biological, psychological, and social factors
- Health is not purely biological
- More modern
- Salutogenic model
- Model concerned with the relationship between health, stress and coping
- Instead of focusing on “what causes disease?”, the model focuses on “what causes health?”
- Health and disease is not a dichotomy but rather a continuum
- Many definitions of health
- WHO recent: “The extent to which an individual or group is able to realize aspirations and satisfy needs, and to change or cope with the environment. Health is a resource for everyday life, not the objective of living; it is a positive concept, emphasizing social and personal resources, as well as physical capacities.”
- Seedhouse: “Health is a state in which people are able to work towards attaining their realistic chosen and biologic potentials”
- WHO 1948: “Health is a state of complete physical, mental and social well-being and not merely the absence of disease or infirmity.”
- Health is one of the basic human rights
- Mental health: “a state of well-being in which the individual realizes his or her own abilities, can cope with the normal stresses of life, can work productively and fruitfully, and is able to make a contribution to his or her community (WHO)”
- Wellness: A continuum of highest health potential <–> normal health <–> illness <–> death
- Involves environmental, social, occupational, intellectual, spiritual, physical and emotional factors
- Indicators of health on a population level
- Life expectancy
- Premature mortality (years of potential life lost, YPLLs)
- Age-specific death rates
- Cause-specific death rates
- Indications of health on an individual level
- Number of days in poor health
- Self-rated health status
- BMI
- Blood tests
- Etc.
3. Determinants of health
- Lifestyle/behavioural (50%)
- Smoking
- Obesity
- Stress
- Poor nutrition
- Alcohol, drug use
- Exercise
- Biology (20%)
- Environmental factors (20%)
- Social factors
- Socioeconomic status
- Social exclusion
- Support network
- Addiction
- Stress
- Social factors
- Health care (10%)
4. Social risk factors
- Psychosocial factors – especially associated with CVD
- Stress
- Hostility
- Depression
- Hopelessness
- Adverse childhood experiences
- Socioeconomic factors
- Poor socioeconomic status/economic disadvantage
- Distribution of income is a key determinant in population health
- Large gap between rich and poor people ruins social cohesion
- Poor socioeconomic status/economic disadvantage
5. Levels of prevention
- Prevention can occur on an individual or on a population level
- Individual level prevention: Counselling, screening, etc.
- Population level prevention: Public health campaigns, programmes, etc.
- Primordial prevention
- (Actually a type of primary prevention)
- Involves establishing conditions which minimize health hazards
- Involves the whole population
- Established through public health policies on a national level
- Examples
- Laws against smoking
- Increasing taxes on unhealthy goods (sugar, alcohol)
- Improve city infrastructure
- Reduce pollution
- Make vaccination programmes
- Improving the socioeconomic status of the population
- Primary prevention
- Reducing risk of disease by altering behaviours or exposures which are risk factors for disease
- Involves the whole population
- Examples
- Immunization (vaccination)
- Lifestyle modification
- Food fortification
- Routine family doctor consultation
- Encourage smoking cessation
- Secondary prevention
- Detecting diseases which are as of yet asymptomatic, before they progress or cause complications or complications
- Treating diseases in these stages is easier and more effective than later stages
- Reduces the impact of a disease or injury which has already occurred
- Involves individuals who are at high risk for the disease
- Secondary prevention does not intend to diagnose diseases, but only to pick up those who may need further testing
- Examples
- Screening for breast cancer, CRC
- Regular blood pressure testing
- Detecting diseases which are as of yet asymptomatic, before they progress or cause complications or complications
- Tertiary prevention
- Managing symptomatic diseases after diagnosis to slow or stop disease progression
- Involves individuals diagnosed with disease
- Examples
- Cardiac rehabilitation
- Monitoring for disease complication
6. Health promotion
- Health promotion is a form of primordial prevention
- It is a process which gives people the ability and knowledge to control and improve their health
- 3 key elements of health promotion according to WHO
- Health literacy: giving people knowledge to make healthy choices
- Good governance – policy makers of the country must prioritize health and assign funds to health
- Healthy cities
- The Ottawa Charter for Health Promotion is an international agreement organized by WHO
- Health impact assessment (HIA)
- HIA is: “a combination of procedures, methods, and tools used to evaluate the potential health effects of a policy, programme or project.” (WHO)
- Before health promotion the population should be assessed to determine which measure should be prioritised
- This is used to make recommendations that will help decision-makers make the best choices
- These recommendations will maximise positive health impacts and minimise negative health impacts of the choices
7. Health politics
- See the relevant comment under “PH4” where a commenter has written what they were asked about
- Health politics refers to distributing power, attention and money to:
- Improve health and wellbeing of populations
- Reduce health inequality
- Strengthen public health
- Ensure universal, sustainable and high quality health systems
- Philosophical level – advocating for the right to health
- Economical level – financing of health care, public health measures
- Education level – implement health programmes in school, etc.
- Also talk about primordial and primary prevention here
8. Maternal and newborn health
- Maternal health
- Before, during and after pregnancy, including during childbirth
- Most maternal adverse outcomes are preventable
- Young, migrant, Roma, low education/low socioeconomic status -> more maternal adverse outcomes
- Diseases during postpartum period
- Postpartum psychosis
- Depression
- Puerperal sepsis
- Maternal mortality
- = number of maternal deaths in a year / number of live births that year
- Very high in high-risk mothers and in developing countries (especially sub-Saharan Africa)
- 800 women die every day due to complications in pregnancy and childbirth
- Causes
- Pre-existing maternal conditions
- Severe bleeding
- Pregnancy-induced hypertension (pre-eclampsia, eclampsia)
- Infection
- Prenatal check-up
- Timing
- Monthly check-up during weeks 1 – 28
- Bimonthly check-up during weeks 28 – 36
- Weekly check-up after week 36
- Involves
- Measure BP, blood sugar
- Prevent smoking, alcohol, drug use
- Giving folic acid supplementation
- Maternal education on good habits, poor habits, etc.
- Testing for infectious diseases
- Ultrasound of foetus
- Timing
- Prevention of maternal diseases
- Birth control
- Pregnancy counselling and family planning
- Mothers < 18 and > 35 are higher risk for both mother and child
- Preconception counselling and assessment
- Pregnancy care
- Postpartum care
- Newborn health
- Definitions
- Newborn = first month of life
- Infant = first year of life
- Postpartum period = 4 – 6 weeks after birth
- Perinatal period = 22 weeks gestation – 1 week after birth
- Most stillbirths are preventable
- Infant mortality
- = number of infant deaths in a year / number of live births that year
- Causes
- In high socio-economic regions
- Congenital deficiencies
- Preterm birth
- SIDS
- In low socio-economic regions
- Infectious diseases
- Malnutrition
- Injuries from labour complications
- In high socio-economic regions
- Risk factors
- TORCH infections
- Teratogenic agents
- Ionizing radiation
- Hormonal drugs
- Cytostatic drugs
- Vitamin A drugs
- Premature (preterm) infant survival
- Infant survival is closely related to low birth weight
- Preterm infants have much higher risk of diseases later, like cerebral palsy
- Causes
- Smoking
- Alcohol
- Drugs
- Maternal diseases
- By time
- 21 weeks gestation – 0%
- Survival rate increases by 2 – 4% per day between weeks 21 and 26
- 26 weeks gestation – 80 – 90%
- Prevention of newborn diseases
- Screening for diseases
- Metabolic diseases
- Phenylketonuria
- Galactosaemia
- Haemoglobinopathies
- Endocrine diseases
- Congenital hypothyroidism
- Hearing loss
- Hip dysplasia
- Metabolic diseases
- Ophthalmic antibiotics
- Vitamin K
- Vitamin D (in some countries)
- Vaccination
- Maternal education and promotion of breast feeding
- Breast feeding exclusively is recommended for first 6 months
- Breast feeding combined with other foods for 2 years or longer
- Screening for diseases
- Definitions
9. Child and adolescent health
- Child health
- Definitions
- Early childhood – age 0 to 4
- Childhood – age 5 to 14
- Adolescence – age 15 to 19
- Youth – age 20 – 24
- Causes of death in children < 5 years
- 45% occur during neonatal period
- 55% occur during the remaining period
- Pneumonia
- Diarrhoeal diseases
- Congenital anomalies
- Injuries
- 80% are due to preventable causes
- School
- School health services are essential in child health
- Prevention of childhood diseases
- Good antenatal care
- Exclusive breastfeeding for 6 months
- Discourage maternal alcohol and smoking
- Regular health checks
- Vaccination
- Provide healthy, safe environments
- Definitions
- Adolescent health
- Most adolescent deaths are due to preventable or treatable causes
- Diseases during adolescence affect the adolescent during this period and later in life
- Causes of adolescent death
- Road traffic injuries
- HIV/AIDS
- Suicide
- Pneumonia
- Causes of adolescent disability or illness
- Depression
- Road traffic injuries
- Anaemia
- HIV/AIDS
- At this age it’s important to engage them in their own care, as this lays the foundation for future health
- Mental health in adolescents
- Depression is top cause of disability
- Suicide is third cause of death
- Violence, poverty, humiliation, bullying, etc. – increase risk
- Road traffic injuries in adolescents
- Young are less able to assess risk, they like to test their boundaries and they overestimate their abilities
- Young drivers are inexperienced drivers
- Males are much more likely to be involved in road traffic injuries than females
- Epigenetic regulation of glucocorticoid receptor (GR)
- Glucocorticoids are involved in perception of stress
- Methylated gene for GR – anxiety (in rat experiment)
- Unmethylated gene for GR – no anxiety (in rat experiment)
- This epigenetic pattern can be modified by environmental and behavioural factors
- Shows one mechanism by which the environment may cause mental health problems
- Prevention of adolescent diseases
- Make health services free/affordable, available, and adapted to adolescents
- Prevent drug use at the national, local, and school level
- Provide free/affordable and available sexual prevention
- Health workers should be competent in working with adolescents
- Promote nurturing family relationships
- Enhance social skills, problem-solving skills and self confidence
10. Health concerns of elderly. Aging societies
- The society is aging – elderly health is becoming more and more important
- Ageing (= greying) of Europe
- Refers to the increase in elderly population relative to the workforce
- Due to decreased fertility, decreased mortality, and higher life expectancy
- Most deaths in developed countries are due to diseases closely related to ageing, like cancer, stroke, heart disease
- There is no evidenced-based proof that dietary supplements delay or stop ageing
- The fact that free radical scavengers doesn’t slow ageing is a counterargument to the free radical theory of ageing
- Theories of ageing
- Researching ageing is difficult, because it is very variable in people, and it occurs over such a long time
- Biological theories
- Programmed theories = ageing occurs due to a programmed change, a biological clock
- Programmed senescence theory
- = senescence (cellular ageing) occurs after a set number of cell divisions (“Hayflick’s limit”)
- Perhaps due to telomeres, which shorten with each cell division
- Endocrine theory
- = hormones control the biological clock
- Especially seen during menopause
- Immunology theory
- = the immune system is programmed to decline over time, increasing the vulnerability to infectious disease, ageing and death
- Programmed senescence theory
- Damage or error theories = ageing occurs due to environmental assaults, which cause cumulative damage
- Wear and tear theory = wear and tear of the body wears out cells
- Free radical theory = accumulating free radicals accumulate damage on cells
- Somatic mutation theory = unrepairable DNA damage accumulates
- Catastrophe theory = enzyme systems are damaged, causing faulty proteins to be synthesized and accumulate
- Cross-linking theory = cross-linked proteins accumulate and cause dysfunction of proteins
- Programmed theories = ageing occurs due to a programmed change, a biological clock
- Psychosocial theories – focus on the psychosocial aspect of ageing
- Disengagement theory = with age decreased engagement of the person in the society is inevitable
- Activity theory = satisfaction of life depends on maintaining interests, hobbies, relationships
- Caloric restriction
- Restriction of calories, as long as malnutrition doesn’t occur, delays ageing and extends lifespan in many species
- A type of protein called sirtuins may be involved in this mechanism
- Hutchinson-Gilford Progeria syndrome
- Progeria means “early ageing” in Greek
- Rare genetic disorder that causes rapid ageing of children
- Death due to age-related diseases occurs at young age
- Due to unstable nuclear envelope
- Werner syndrome (= adult progeria)
- Rare genetic disorder which causes earlier ageing
- Death occurs at around 40 – 50
- Somatic mutation in WRN gene, which encodes for a DNA repair protein
- Physiological changes in ageing
- Decreased height, increased/decreased weight
- Changed posture
- Skin changes
- Dental changes
- Decreased muscle mass
- Decreased brain mass
- Slower neural conduction
- Decreased kidney function
- Decreased lung function
- Presbyopia
- Presbycusis
- Sense of thirst and hunger decreases
- Health problems of elderly
- Often have multiple conditions at the same time
- These conditions may affect each other, and affect the possibilities of treatment
- Symptoms may be different than in younger adults or completely absent
- Silent myocardial infarction
- Pneumonia without fever
- Thyroid dysfunction without typical symptoms
- The pharmacodynamics and pharmacokinetics change, changing how drugs affect the patient
- 5 “I”s of geriatric care – Immobility, incontinence, instability, intellectual decline, iatrogeny
- Hospice care – care of terminally ill patients
- Complex treatment; physical, psychosocial, and spiritual
- Goal: to improve quality of life, relieve physical and mental suffering
- Involves palliative medicine, which focuses on reducing pain and other symptoms
- Main causes of morbidity in elderly
- Cardiovascular disease
- Cancer
- Musculoskeletal disease
- Metabolic disorders
- CNS disorders
- Depression
- Falls
- The most common cause of injury
- Due to physical, sensory, and cognitive changes like slow reflexes, hypotension, etc.
- Main causes of death in elderly
- Heart disease
- Cancer
- Chronic lower respiratory disease
- Stroke
- Alzheimer disease
- Prevention of elderly morbidity and mortality
- Aim: increase number of health life years, reduce damage
- Primary prevention
- Proper nutrition
- Encourage and enable physical activity
- 3x a week
- Avoid risk factors (alcohol, smoking, etc.)
- Prevent falls (by adapting the environment, etc.)
- Ensure social support
- Secondary prevention
- Screen for hypertension, diabetes, hearing and vision loss, osteoporosis, cancer, depression, etc.
- Tertiary prevention
- Reduce relapse and complications of diseases
- Early rehabilitation
11. Minorities: Health issues and disparities
- Unemployed persons
- 8 – 9% in Hungary
- Stages of unemployment
- 1 – sense of relief
- 2 – unsuccessful in seeking work
- 3 – gives up hope of finding work
- 4 – crumbling life
- Consequences
- Hypertension
- Increased risk for poor habits
- Stress
- Depression
- Suicide
- People in poverty
- Subsistence level of poverty – barely enough money to exist
- Increased risk of infectious disease, STD, malnutrition
- Social minimum level of poverty – money only for the basics
- Increased risk of cardiovascular disease, mental disorder
- Subsistence level of poverty – barely enough money to exist
- Homeless persons
- Causes
- Family problems
- Poverty
- Unemployment
- Prison release
- Steps in becoming homeless
- Losing connection with home
- Newly formed homelessness
- Chronic homelessness
- 80% men
- Consequences
- Alcohol
- Street accidents
- Violence
- Death by freezing
- Infectious diseases
- Causes
- Refugees
- Usually have poorer health than the country they migrate to
- Malnutrition, infectious disease, disability, mental disorders are frequent
- Insufficient vaccinations, pregnancy and infant care
- Ethnic minorities
- Examples
- Roma people
- African Americans
- Sami/Lapp people
- Usually have low level of education and low socioeconomic status
- Often have poor living conditions
- This increases risk for infections
- Higher risk for infant, child, and maternal mortality
- Higher risk for alcoholism, infections
- Examples
- Prevention of morbidity and mortality of minorities
- Mainly a problem of health politics
- Health care must be equipped to deal with these populations
12. Health issues and disparities of people living with disabilities
- Disability = lack of ability compared to a standard or norm
- Mental disability (impaired intellectual ability)
- Physical disability (mobility)
- Sensory disability (visual/hearing)
- Physical disability
- = impaired ability to move or coordinate movements
- The most frequent disability (10% of USA)
- Due to musculoskeletal or neurological problems
- Causes
- Accidents, injuries
- Genetic diseases (muscular dystrophies, etc.)
- Developmental disorders (intrauterine infections or chemical exposure)
- Thalidomide
- Osteoporosis
- Consequences
- Muscle atrophy
- Psychological
- Depression
- Social
- Family care is usually needed
- Impaired career and employment possibilities
- Prevention
- Primary
- Ensure calcium and vitamin D intake (reduces osteoporosis)
- Weight-bearing exercise (reduces osteoporosis)
- Enforce road safety
- Reduce alcohol
- Disability-friendly buildings, etc.
- Secondary
- Screening for musculoskeletal disorders
- Regular physical examination
- Primary
- Mental disability
- Affects 3% of population
- Causes
- Idiopathic
- Down syndrome
- Foetal alcohol syndrome
- Risk factors
- Poor maternal nutrition
- Perinatal trauma
- Neonatal jaundice
- Postnatal infections or toxins
- Present for birth or early infancy
- Limits normal activities of life
- Diagnosed based on IQ, adaptive skills
- Mild mental retardation < 70 IQ
- Severe mental retardation < 35 IQ
- Down syndrome
- Most frequent cause of mental disability
- Characteristic facial features
- High maternal age is the most important risk factor
- Frequent health problems (congenital heart disease, cataract, poor immune system, leukaemia)
- Prevention
- Pregnancy counselling
- Prenatal diagnosis
- Neonatal screening for metabolic disorders
- Visual disability
- Causes
- Idiopathic
- Cataract
- Glaucoma
- Diabetic retinopathy
- Vitamin A deficiency
- Infections
- Consequences
- More frequent accidents
- Depression
- Prevention
- Primary
- Ensure vitamin A intake
- Increase safety of environment
- Disability-friendly buildings, etc.
- Secondary
- Regular physical examination
- Tertiary
- Treat underlying cause
- Primary
- Causes
- Hearing disability
- Affects 10% of developed countries
- Causes
- Noise-induced
- Frequent otitis media in childhood
- Congenital conditions
- Prevention
- Primary
- Reduce noise pollution
- Increase safety of environment
- Disability-friendly buildings, etc.
- Secondary
- Screening for hearing loss in infants
- Tertiary
- Prevent further hearing loss
- Primary
13. Evidence-based medicine and prevention
- Evidence-based medicine (EBM) is “the conscientious, explicit and judicious use of current best evidence in making decisions about the care of individual patients.”
- = the process of turning clinical problems into questions and then systematically locating, appraising, and using contemporaneous research findings as the basis for clinical decisions
- EBM is the gold standard of clinical practice
- Uses information gathered from randomized control trials, case controls, cohort studies, etc.
- Meta-analyses and systemic review combine the result of multiple trials into the strongest evidence
- Process of EBM
- A patient problem occurs
- A clinical or preventional question is formulated
- Evidence is searched for or produced
- The evidence is critically evaluated
- The results are integrated into clinical practice
- Some clinical practices which changed due to evidence-based medicine
- Antiarrhythmic drugs much less used
- Thalidomide contraindicated in pregnancy
- Grading of evidence shows the quality of evidence which underlies a clinical recommendation
- Grade A refers to a recommendation which is the result of many randomized clinical trials
- Grade B refers to a recommendation which is the result of one randomized trial, or multiple nonrandomized trials
- Grade C refers to a recommendation which is based on expert consensus, without good clinical trials
- Classification of evidence shows the strength of the clinical recommendation
- A class I recommendation is one where the procedure or treatment is recommended, as the evidence shows that the procedure or treatment is clearly beneficial
- A class IIa recommendation is one where the procedure or treatment should be considered, as the evidence shows that the procedure or treatment is beneficial in most cases
- A class IIb recommendation is one where the procedure or treatment may be considered, as the evidence shows that the procedure or treatment is beneficial in some cases
- A class III recommendation is one where the procedure or treatment is not recommended, as the evidence shows that the procedure or treatment is ineffective or harmful
14. History and objectives of epidemiology
- Epidemiology is the study of determinants and distribution of disease
- Clinical epidemiology is the use of epidemiology to improve prevention, detection, and treatment of disease
- History of epidemiology
- Hippocrates: “Quality of water, how people live, what they drink and eat, whether they exercise, affect their health”
- Ignaz Semmelweis discovered that hand disinfection reduced the incidence of puerperal fever
- John Snow
- The father of epidemiology
- Challenged the “miasma theory”, which described that disease occurs due to “miasma”, an airborne poison from unsanitary conditions
- Snow’s hypothesis was that a part of London had increased incidence of cholera due to that part of London receiving water from a polluted part of the river Thames
- He also traced a cholera outbreak to a single water pump which was contaminated by a young cholera patient
- James Lind: divided sailors with scurvy into groups, and gave citrus fruits to some of them
- Sir Percival Pott:
- Recognized the association between scrotal cancer and chimney sweeping
- Katsusaburou Yamagiwa: Confirmed that coal tar could induce cancer by inducing cancer in rabbit ears
- Eradication of smallpox in 1978
- Identification of AIDS, prediction that it was due to a sexually transmitted virus and development of preventative measures before the HIV virus itself was identified
- Infants who lie on their stomach have much higher risk of SIDS
- Objectives of epidemiology
- Description of diseases occurrences and patterns
- Identification of causative agents and risk factors
- Application of results at the population level
15. Causation in epidemiology: association and causation
- Causation: whether an exposure actually causes a specific disease
- or: whether the association between an exposure and a disease is causative
- Bias, confounding and chance must all be eliminated to establish a causal relationship
- Koch’s postulates for causation (of infectious diseases) states that the causative agents can:
- Be isolated from the affected organism in a culture
- Be cultured
- Produce the same disease in a second animal
- Be isolated from the second animal
- Epidemiological triangle
- Host factors, environmental factors and the causative agent all play a role in disease development
- Causative agents can be nutrients, poisons, microorganisms, radiation, trauma, etc.
- Host factors can be genetic susceptibility, immunological state, age, lifestyle, etc.
- Environmental factors can be crowding, housing, atmosphere, etc.
- Five rules (of causation) in epidemiology (similar to the Bradford-Hill criteria)
- There must be a high relative risk
- The results must be consistent
- There must be a graded response to a graded dose
- I.e., a higher dose increases risk
- There must be a temporal relationship, i.e. the disease must occur after the exposure
- There must be a plausible mechanism by which the exposure causes the disease
- The British Doctors’ study was historical, as it proved the causation between smoking and lung cancer
16. Epidemiological indicators I: indicators of disease frequency and population impact of a disease
- Maths
- A fraction = number of cases / population
- A ratio = a number in relation to another one
- A proportion = the ratio of a part of the population to the total
- A rate = a proportion over time
- Indicators of disease frequency
- Number of cases
- Simplest measure, but doesn’t take into account the size of the population
- Useful for allocating health resources
- Incidence rate
- New cases of a disease in the population over a period of time
- Good for diseases with a short duration
- Important when studying the etiology of the disorder
- Cumulative incidence rate
- Proportion of new cases in the population over a period of time
- Number of new cases over a period of time / population at risk over that period of time
- For example: out of 5500 sex workers at risk for HIV in a 4-year period, 40 contracted HIV -> 40/5500 = 0,007 = 7%
- Easy to interpret
- Incidence density
- Number of new cases in the population / the number of time the population has spent at risk
- The unit of the incidence density is “cases of disease/patient-year”
- For example: 194 cases of breast cancer per 100 000 patient-years
- Difficult to interpret
- Gives a better estimate of true risk than the incidence
- Prevalence rate (often called just prevalence)
- Measures all cases in the population, not just new cases
- Period prevalence = number of all cases over a period of time / population at risk over that period of time
- Point prevalence = number of all cases at a certain point in time / population at risk at that point in time
- Lifetime prevalence = number of people who ever had the disease during their lifetime / population at risk at the beginning of the period
- Good for permanent diseases, conditions, or risk factors
- Gives an estimate of societal burden of the disorder
- Relationship between incidence and prevalence
- A common disease with short duration, like the common cold, has a high incidence but low prevalence
- A less common disease with a long duration, like diabetes type 2, has a low incidence but high prevalence
- Morbidity rate – when we measure cases of disease
- Mortality rate – when we measure death caused by disease
- Lethality (case fatality rate)
- = number of people who died because of disease / number of people who had the disease
- Number of cases
- Indicators of population impact of a disease
- These are all measures of disease burden
- Attributable risk (AR)
- Shows the proportion of cases in exposed individuals which can be attributed to the exposure
- The difference between the risk of disease in the population exposed to the risk factor, and the risk of disease in the non-exposed population
- AR = incidence of exposed population – incidence of non-exposed population
- Used in cohort studies
- Population attributable risk (PAR)
- Shows how much of the incidence of a disease would decrease if the risk factor was eliminated
- The difference between the risk of disease in the population as a whole, and the risk of disease in the population not exposed to the risk factor
- PAR = incidence of whole population – incidence of non-exposed population
- Years of potential life lost (YPLL)
- How many years a young person would live if they didn’t die prematurely
- Quality-adjusted life year (QALY)
- Used to evaluate the value of public health interventions
- Disability-adjusted life year (DALY)
- Includes both YPLL and QALY into one measurement
- DALY = years lived with disability + years of life lost
- Numbers needed to treat
17. Epidemiological indicators II: definition and measures of relative risk and odds ratio
- Risk is a proportion; odds is a ratio
- Risk
- = the probability that an event will occur
- Risk = number of times an event occurred / total number of possible occurrences
- Estimated based on incidence
- If there are 10 people with cancer, and 6 die, the risk of dying is 6/10 = 60%
- Odds
- = the chance that an event will occur
- Odds = number of times an event occurred / number of times the event didn’t occur
- If there are 10 people with cancer, and 6 die, the odds of dying is 6/4
- Indicators of association between the disease and its risk factors
- Relative risk
- Odds ratio
- Proportional mortality ratio
- Standardized ratio
- Relative risk (RR)
- The proportion of risk for a particular disease in the risk factor-exposed and non-risk factor-exposed population
- Basically how much higher the risk of disease is in those who are exposed to a certain risk factor
- If RR > 1 there is a positive association between factor and the disease, so it is a risk factor
- If RR = 1 there is no association between factor and the disease
- If RR < 1 there is a negative association between factor and the disease, so it is a protective factor
- RR indicates the strength of the association
- Example from John Snow’s water pump:
- People who drank water from the pump had 58,4% risk of cholera, while those who didn’t had only 6,7%
- The relative risk is 0,584/0,067 = 8,72. The risk of cholera was almost 9 times higher in those who drank from the pump
- Used in cohort studies
- Odds ratio (OR)
- The ratio of the odds of having the disease in the population exposed to the risk factor and the odds of having the disease in the non-exposed population
- If OR > 1 the disease is more likely in exposed than non-exposed population
- If OR = 1 the disease is equally likely in exposed and non-exposed population
- If OR < 1 the disease is less likely in exposed than non-exposed population
- Used in case-control studies to measure the strength of association between risk factor and disease
- In case-control studies, relative risk can’t be calculated. However, for rare diseases, the OR is almost equal to the RR and is therefore used to estimate it
- The ratio of the odds of having the disease in the population exposed to the risk factor and the odds of having the disease in the non-exposed population
18. Standardization
- Standardization is used to reduce the effects of confounding variables like age and gender
- Standardization is necessary to compare mortality or morbidity rates of populations with different age or gender distribution
- Comparing the crude rates of these populations would be misleading due to different age and gender distribution
- Direct and indirect methods of standardization exist
- These methods compare the mortality or morbidity rate of the measured population to the rates of a standard population
- Direct standardization
- Determine the age-specific mortality rates of your measured population
- Apply these mortality rates to the standard population to get the “expected” mortality rate
- Compare the expected mortality rate of the standard population to the measured mortality rate of the measured population
- Indirect standardization
- It is used instead of direct standardization if there is insufficient data or if the population is small
- Yields the standardized mortality ratio (SMR)
- SMR = the number of deaths in the study population / the number of deaths that would be expected in the study population if that population had experienced the death rates of the standard population
- SMR allows comparison of mortality rate with the mortality rate of the standard population or other standardized population
19. Epidemiological studies: parameters, design
- Epidemiological studies can be classified according to
- What the aim is
- Descriptive = describe patterns of disease occurrence in relation to variables
- Case reports
- Case series
- Analytical = test specific hypotheses
- Ecological studies
- Cross-sectional studies
- Case control studies
- Cohort studies
- Clinical trials
- Descriptive = describe patterns of disease occurrence in relation to variables
- The time period evaluated
- Retrospective = back in time
- Concurrent = current point in time
- Prospective = forward in time
- Whether interventions were performed
- Observational = no interventions were performed, only observation
- Case reports
- Case series
- Case control studies
- Cohort studies
- Ecological studies
- Cross-sectional studies
- Experimental/interventional = interventions or experiments were performed
- Clinical trial
- Field trial
- Observational = no interventions were performed, only observation
- What the aim is
20. Descriptive epidemiological studies, cross-sectional studies
- Descriptive studies
- These studies try to identify the relation between a disease and factors like age, gender, occupation, place, time, etc.
- In descriptive studies no hypothesis is formed and no analysis is performed
- Case report
- Description of a case, usually a patient, in a manner which provides information
- Not a true epidemiological study, as only one case is reported
- However, many case reports with similar features may raise suspicion of an underlying epidemic
- This is how AIDS was discovered
- Example: a report of a patient with a rare disease, or unusual symptoms of a disease
- Case series
- A series of similar patient cases
- Common characteristics between cases can be identified
- Example: a series of cases of patients with the same disease
- A register is a complete set of case series for an area
- Registers provide information of disease burden in a country
- Cross-sectional studies
- Can be descriptive or analytical
- Concurrent (does not look back or forward in time)
- The exposure and outcome (disease) are measured simultaneously
- Steps
- (Randomly) select a study population
- Divide them into 2 groups depending on whether they currently are exposed to the factor in question
- Further divide these 2 groups into 2 groups depending on whether they have the disease in question
- We can now evaluate the association between the factor and the disease
- Advantages
- Inexpensive
- No need to wait for the outcome to happen
- Disadvantages
- Gives odds ratio and prevalence, not incidence
- Very susceptible to bias
- Difficult to establish a causal relationship with
21. Ecological studies. Immigrant studies
- Ecological study
- Also called a correlational study
- A study which aims to identify a correlation between a risk factor or protective factor and a disease
- Use data which is already collected, from
- Census data
- Registries
- Etc.
- Doesn’t use data based on individual cases
- Uses data based on the whole population, like disease prevalence, incidence, mortality
- Focuses on specific problems, like within a region or population
- Advantages
- Inexpensive
- Easy to carry out
- Disadvantages
- Prone to bias and confounding
- Example:
- Comparing the prevalence of a disease in different regions
- Finding the association between suicide rate and proportion of Protestant religion in different Prussian provinces
- The ecological fallacy
- = incorrectly assuming that an association seen at a populational level also reflects association at an individual level
- Example
- There is good correlation between salt intake and hypertension when comparing different countries
- However, correlation on an individual level is difficult to demonstrate
- Immigrant studies
- Compares immigrants to other populations, allowing the evaluation of the effect of the environment while the genetic background remains the same
- Compares disease incidence between:
- A group of migrants to a new country
- Ethically similar people in their native country
- The native population of the new country
- Example
- Cancer rates among Japanese immigrants in the US approached the US cancer rate after 2 generations
22. Case-control studies
- Most frequently performed epidemiology studies
- A retrospective study – healthy and sick people are found, and their previous exposure to a factor is determined
- Aim: to study if an exposure (usually a risk factor) is associated with a disease
- Steps
- Select patients with the disease = the cases
- Select persons without the disease with similar baseline characteristics as the cases = the controls
- Compare the exposure of risk factors between these groups
- Find how many of the cases were exposed to the risk factor
- Find how many of the cases were not exposed to the risk factor
- Find how many of the controls were exposed to the risk factor
- Find how many of the controls were not exposed to the risk factor
- The odds ratio between the groups is determined
- Controls
- Should be picked from the same source population as the cases
- Must be at risk of the disease
- Must have comparable characteristics as the cases
- Pros
- Fast, cheap
- Good for rare diseases
- Can study multiple exposures
- Cons
- Can’t determine incidence rate
- Does not provide relative risk (RR)
- Possibility of recall and selection bias
- Example
- Richard Doll’s study which established the link between smoking and lung cancer
23. Cohort studies
- Also called follow-up studies, incidence studies, longitudinal studies, etc.
- Can be prospective or retrospective
- Prospective cohort study – healthy people with and without exposure to a factor is found and followed up until disease
- At the point of the study only the exposure, not the disease, has occurred
- Example: People who smoke and people who don’t smoke are chosen. They’re followed up until disease develops.
- Retrospective cohort study – a population with a disease is found. Historical data is used to separate the population into those who had the exposure and those who didn’t
- At the point of the study both the exposure and the disease has occurred
- Example: People with lung cancer are chosen. Their previous exposure to second-hand smoke is determined.
- Retrospective cohort studies are less important than prospective ones
- Prospective cohort study – healthy people with and without exposure to a factor is found and followed up until disease
- Assessment of exposure can be done in multiple ways
- By checking existing data, like medical records
- By giving questionnaires
- By measuring
- Prospective studies require an initially disease-free population
- The population must be screened for the disease
- Pros
- Good for rare exposures
- Give the strongest evidence for causation
- Give incidence rates, relative risk (RR) and odds radio (OR)
- Cons
- Not good for rare diseases
- Rxpensive
- Time-consuming
- Needs large sample size
- Comparison between retrospective cohort study and case control study
- In both, both the exposure and the disease have already occurred
- In a retrospective cohort study two similar populations are found, one exposed and one non-exposed. Both populations have the disease in question. The exposed and non-exposed group are compared, and the exposure’s effect on the outcome is determined.
- The RR and OR are calculated
- Only diseased people are examined
- In a case control study two similar populations are found, one with the disease and one without. Both populations are examined for exposure to the factor. The exposure’s effect on the outcome is determined.
- Only the OR can be calculated
- Both diseased (cases) and non-diseased (control) people are examined
- Examples
- British Doctors’ study (prospective cohort)
24. Experimental (interventional) epidemiological studies
- Clinical trials vs field trials
- Clinical trials
- Are performed on patients
- Involve treatments
- Determine secondary and tertiary preventative measures
- Field trials
- Are performed on healthy people
- Involve prophylactic measures
- Determine primary preventative measures
- Clinical trials
- Randomized control trials (RCT)
- Gold standard of clinical trials
- Steps
- People from a sample population are randomly allocated into an intervention group and a control group
- The intervention group is given the drug/therapy/etc.
- The control group is given a placebo/the current gold standard in therapy/nothing
- After a period of time the incidence of a specific disease between the two groups is compared
- Blinding
- No blinding – the researchers and the study participants know which group they belong to
- Single-blinded – only the researchers know which group the study participants belong to
- Double-blinded – neither the researchers nor the study participants know who is in the control and who is in the interventional group
- Examples
- 2 studies tried giving beta-carotene to smokers to see if cancer risk reduced – but the cancer risk actually increased
- Crossover trial
- Similar to RCT, but the people in the control and intervention group switch during the trial period
- This allows the patients to serve as their own controls
25. Meta-analysis, systematic review
- These are the highest-quality studies
- No new data is collected; results from previous studies are combined
- Combining multiple studies reduces biases and improve statistical power
- Meta-analysis
- Data from multiple similar studies is processed with statistical methods
- Can be performed when there are multiple studies addressing the same question
- Answers questions like:
- What is the size of the effect?
- Is the effect consistent across studies?
- What is the strength of evidence for the effect?
- Steps
- Identify relevant studies and exclude poorly conducted studies
- Perform statistical analysis
- Which studies are included and which are excluded are very important for the validity of the results
- Systematic review
- Data from multiple similar studies is evaluated, but not necessarily processed with statistical methods
- Systematic review often include a meta-analysis
- Systematic review is needed because:
- There are way too many individual studies to keep in mind
- The sheer number of studies isn’t wanted; what is wanted is high-quality evidence
- Individual studies contain bias, which can be reduced by systematic review
- It produces a clear and consistent summary of the science on the question
- Often times different studies yield conflicting results, which a systematic review may yield information on
- May include unpublished data, to prevent publication bias
- Steps
- Defining an appropriate question
- Identify relevant studies and exclude poorly conducted studies
- Assess quality of each study or report
- Combine findings from the studies
- Interpret findings and present a balanced and impartial summary
- Data from multiple similar studies is evaluated, but not necessarily processed with statistical methods
26. Errors and bias in epidemiological studies
- Chance, bias, and confounding should be ruled out in order to talk about a valid statistical association
- A valid statistical association does not imply causation!
- For example, incidence of prostate cancer has increased recently, as have the sales of flat-screen TVs. But there is no causation
- The two types of errors in epidemiology
- Type 1 error – when we conclude that there is a difference when in reality there is no difference
- To avoid type 1 errors, we strengthen the statistical power, by using statistic significance, p < 0,05, confidence intervals, etc.
- Type 2 error – when we conclude that there is no difference when in reality there is one
- To avoid type 2 errors, we must use a large sample size and accurate measurements
- Type 1 error – when we conclude that there is a difference when in reality there is no difference
- Bias
- A bias is a systematic error which leads us to conclusions which are systematically different from the truth
- Bias does not apply equally to the different groups measured
- Selection bias
- Occurs when the sample group is not representative of the population from which it is drawn
- Examples
- Healthy worker effect – the working population is healthier than the general population, so a sample of working people does not represent the general population
- Volunteer bias – people who volunteer to join a study have different characteristics than the general population
- Volunteers are generally more healthy, have lower mortality and are more likely to comply with doctor’s orders
- Prevented by randomizing instead of selecting people to the groups, and making sure the sample group is representative of the population
- Information bias
- Occurs during collection, analysis, and interpretation of data
- Examples
- Recall bias – people who are diseased may recall their exposure to risk factors better than those who are healthy
- Interviewer bias – different interviewing approaches towards different groups prompt different responses
- Publication bias – when the outcome of a study influences the decision to publish the study
- Studies which find no association are often not published, despite these results being as important as studies which find associations
- Misclassification = assigning someone to the wrong group
- Bias in screening
- Volunteer bias
- Length bias
- Screening selectively identifies patients with a long preclinical and clinical phase and less frequently identifies patients with shorter phases
- The patients with long phases would have a better prognosis regardless of the screening program
- Lead-time bias
- Screening causes cases to be diagnosed earlier in the natural history of the disease
- This makes it seem like the patients live longer, but this is just because of the earlier diagnosis and not because of the earlier treatment
- Atomistic fallacy
- Observations at the individual level are not necessarily true on the populational level
- Examples
- Infant mortality is associated with low birthweight on an individual level, but not on the populational level
- Same with CHD and income, or suicide and income
27. Confounders, effect modifiers and possibilities for elimination
- Confounding
- A confounding variable is a variable which has not been considered in the study, but which correlates with the risk factor and disease
- What the study observes: risk factor exposure –> disease
- What the reality is: risk factor exposure < –> confounding variable –> disease
- There is no direct association between risk factor exposure and disease
- Example 1:
- A study finds that people who drink coffee have increased risk for lung cancer, and therefore concludes that there is an association between coffee and lung cancer
- However, many coffee-drinkers also smoke, and that it is the smoking which increases the risk for lung cancer
- Smoking is the confounding variable here
- Example 2:
- A study finds that children born later in the birth order have higher risk of Down syndrome, and therefore the study concludes that there is an association between late birth order and Down syndrome
- However, the children who are born later in the birth order are often born by older mothers, and it is the maternal age which increases the risk for Down syndrome
- Maternal age is the confounding variable here
- To prevent confounding
- Perform multiple studies with different populations
- Select comparable groups
- Randomize study groups
- Matching
- Standardization
- Effect modifiers
- An effect modifier is a third variable which has different effect between study groups
- This influences the study outcome
- Example 1
- Tetracycline discolours teeth in children, but not in adults
- Tetracycline has different effects between study groups
- Example 2
- Hypertension is more likely to cause myocardial infarction in people with hypercholesterolaemia than people without
- Hypertension has different effects between study groups
- An effect modifier is a third variable which has different effect between study groups
28. Molecular epidemiology
- Molecular epidemiology focuses on the contribution and interaction of genetic and environmental risk factors, identified at the molecular level, to disease
- Uses techniques of molecular biology, like PCR, next generation sequencing (NGS), ELISA, western blot, etc.
- Aims to identify:
- Biomarkers of genetic susceptibility
- Biomarkers of exposure
- Biomarkers of effect
- Biomarkers of disease
- Genetic susceptibility
- Some genotypes are protective against a risk factor, meaning that exposure causes less risk for disease than the general population
- Some genotypes are susceptible against a risk factor, meaning that exposure causes more risk for disease than the general population
- Example study 1: “Associations between XRCC1 and ERCC2 polymorphisms and DNA damage in peripheral blood lymphocyte among coke oven workers” (Leng et al, 2004)
- Showed that certain differences (polymorphisms) in the genes XRCC1 and ERCC2 were associated with decreased DNA-repair capacity toward PAH-induced DNA damage
- Example study 2: “Urinary 1-hydroxypyrene concentrations in Chinese coke oven workers relative to job category, respirator usage, and cigarette smoking” (Chen et al, 2007)
- Showed that smoking oven workers had higher urinary concentration of 1-hydroxypyrene than non-smokers
- 1-hydroxypyrene is a marker of air pollution exposure
- NAT2 is a gene involved in biotransformation of drugs (more here)
- Some people have a slow version of the gene (slow acetylators)
- Some people have a rapid version of the gene (rapid acetylators)
- Studies have shown that slow acetylators have higher risk of CRC
- Polymorphisms in p53, mEH and XRCC1 are also associated with CRC
- Polymorphisms in GSTM and NAT2 influence the amount of DNA damage accumulated based on diet
- Rapid acetylators sustain more DNA damage during a meat-containing diet than slow acetylators
- GSTM1 negative people sustain more DNA damage during a meat-containing diet than GSTM1 positive people
29. Basic principles of screening
- Screening program = comprehensive program on identification of persons with unrecognized disease or risk factors for disease
- Screening test = a test used for the identification of persons with unrecognized disease or risk factors for disease
- Screening is a simple process which classifies persons into one of two groups
- The first group is for those with a positive screening test. They should undergo further testing or initiate treatment
- The second group is for those with a negative screening test. The probability that they have the disease is too low to justify further testing or treatment
- Requirements for screening
- Early detection must lead to a favourable diagnosis (i.e., the disease can be treated in the early stages)
- The disease should be serious
- The disease should be relatively common
- If left undiagnosed, the disease will progress
- Important properties of a screening test
- Must be simple to perform
- Must be inexpensive
- Must be safe
- Must be accurate
- The results must be reliable
- Evaluation of a screening program
- Reliability – the ability of a test to give consistent results when repeated on the same person under the conditions
- Feasibility – for a screening program to be feasible it must be quick, easy to do, safe, cost-effective, not very uncomfortable and must not cause side-effects
- Validity – the screening test must have high sensitivity and ideally high specificity as well
- Performance – the screening test must have high positive and negative predictive values
- Predictive values depend on the disease prevalence in addition to the specificity and sensitivity
- Yield – the screening program must cause a significant decrease in unrecognized disease cases
- Effectiveness – the screening program must be effective in reducing disability, morbidity, and mortality from the disease
- This is obviously the most important point
- There are four possible outcomes of a screening test
- A person is a true positive – i.e. they test positive and they have the disease
- The screening was good for this person
- A person is a true negative – i.e. they test negative and they don’t have the disease
- The screening was good for this person, as it reassures them that they don’t have the disease
- However, they are still exposed to the costs, inconvenience, and hazards of screening
- A person is a false positive – i.e. they test positive but don’t have the disease
- Upon further testing they will test negative, but for this person the screening only serves to cause unnecessary psychological and emotion distress, in addition to the costs, inconvenience, and hazards
- A person is a false negative – i.e. they test negative but do have the disease
- The screening gives this person a false sense of reassurance, while exposing them to costs, inconvenience, and hazards
- A person is a true positive – i.e. they test positive and they have the disease
30. Optional and mandatory screening
- Mandatory screening
- Breast cancer
- Clinical breast exam every 3 years after 20
- Yearly mammogram after age 40
- High-risk women must be screened earlier and more often
- Colorectal cancer
- After age 50
- By colonoscopy, CT colonography, sigmoidoscopy, faecal occult blood test, etc.
- High-risk persons must be screened earlier
- Cervical cancer
- After age of sexual debut
- Pap smear every year
- Tuberculosis screening for health workers
- Breast cancer
- Optional screening
- In newborns
- Optional in Norway, mandatory in some countries
- Phenylketonuria
- Hypothyroidism
- Galactosaemia
- Cystic fibrosis
- Hearing loss
- Haemoglobinopathies
- In adults
- Prostate cancer
- After age 50
- PSA and digital rectal examination
- Start at age 40 or 45 in case of higher risk
- Prenatal screening for foetal abnormalities
- Tests for trisomies and other sex chromosome conditions
- Prostate cancer
- In newborns
31. Demography: definition, methods, data sources
- Demography is the scientific study of the determinants and consequences of changes in human population
- You can only enter a population by birth or migration, and you can only leave it by death or migration
- Therefore, fertility, mortality, and migration are important in the study of demographics
- Keeping record of birth and death is simple; migration is not always registered and therefore more difficult to keep record of
- Variables in demography
- Age
- Gender
- Income
- Occupation
- Health service use
- Geographic location
- Geographic density
- T.R. Malthus – first person to draw attention to fertility and mortality
- He postulated that population tends to grow geometrically while food supply grew only arithmetically (i.e., the population grows much faster than the food supply)
- This is sometimes called the Malthusian trap
- Because of the Malthusian trap, war, disease, hunger would control the population growth
- However, the industrial revolution made an exponential growth in food supply possible, bypassing the Malthusian trap and allowing for a population explosion
- He postulated that population tends to grow geometrically while food supply grew only arithmetically (i.e., the population grows much faster than the food supply)
- Data sources
- Vital statistics registries
- Vital statistics registries continuously collect information of demographic events like birth, deaths, marriages, etc., as they occur
- Census
- A census occurs every 10 years and collects demographic and other data at that point in time
- While vital statistics registries are continuously collected, a census occurs only every 10 years
- The collection of this data can occur by sending out questionnaires in the mail, or by collecting data from digital registers
- Direct data can be collected from registries of vital statistics or censuses
- These registries track all births, deaths, marriage, divorce, migration
- In developed countries these are the best sources
- Indirect data can be collected by asking women how many sisters have died or had children, asking people about siblings, parents, etc.
- From this, researchers can indirectly estimate data for the whole population
- Necessary in countries which don’t keep registries
- Vital statistics registries
32. Demographic indicators: measures of mortality
- Crude death rate – annual number of deaths per 1000 people
- Highest in sub-Saharan Africa, Middle East (15 – 20)
- Lowest in Western countries (1 – 10)
- Average in the world: 7
- Infant mortality rate – annual number of deaths of children < 1 year per 1000 live births
- Highest in sub-Saharan Africa, Middle East (80 – 100)
- Lowest in Western countries (0 – 10)
- Maternal mortality rate – annual number of deaths from puerperal causes per 100 000 live births
- Highest in sub-Saharan Africa, Middle east (200 – 500)
- Lowest in Western countries (0 – 15)
- Life expectancy at birth – the number of years an individual could expect to live
- Highest in Japan, Western Countries (77+)
- Lowest in sub-Saharan Africa, Middle East (45 – 60)
- Age-specific death rate – annual number of deaths in an age group divided by number of persons in that age group
- Cause-specific death rate – annual number of deaths of a specific cause divided by the size of the population
- Top causes of death in 1900
- Pneumonia
- Tuberculosis
- Diarrhoea
- Top causes of death nowadays
- Heart disease
- Cancer
- Cerebrovascular disease
- Top causes of death in developed countries
- Heart disease
- Cancer
- Cerebrovascular disease
- Top causes of death in developing countries
- HIV/AIDS
- Pneumonia
- Heart disease
- In developed regions 77% of deaths are due to non-communicable diseases, only 14% are due to communicable diseases
- In developing regions 55% of deaths are due to communicable diseases, only 37% are due to non-communicable diseases
33. Demographic indicators: measures describing population groups. Population pyramids
- Dependency ratio is the ratio of the population who are economically inactive to those who are economically active:
- Dependency ratio = population < 15 and > 65 / population between 15 and 65
- Population size – the number of individuals in the population
- Population density – the number of individuals in the population per unit of area
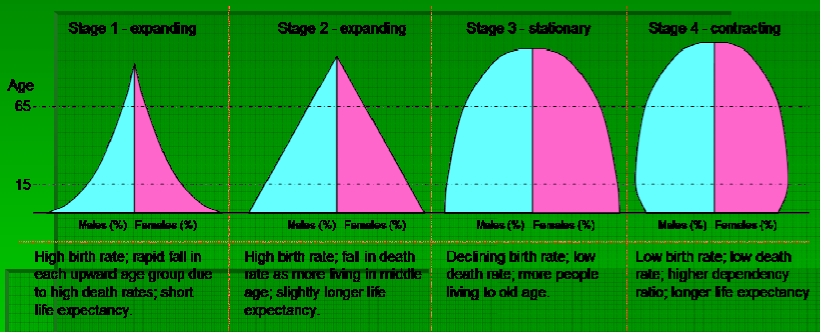
- Age structure – the age structure of a population is shown by the population pyramid
- Most developed countries have contracting population pyramids
- Most developing countries have expanding or stationary population pyramids
- Population pyramids
- Population pyramids are formed according to age and gender
- They change shape according to the epidemiological stage
- Major demographic characteristics of developing countries
- High fertility
- High infant mortality
- High prevalence of HIV/AIDS
- High level of out-migration
- Major demographic characteristics of developed countries
- Low levels of fertility – often lower than the replacement level of 2.1
- Women have babies at later ages
- High level of in-migration
- Trends in age groups
- In Europe, people < 15 are decreasing, 15 – 60 are decreasing, > 60 are increasing rapidly
- In Asia, people < 15 are stable, 15 – 60 are increasing rapidly, > 60 are increasing
- In Africa, all age groups are increasing rapidly. 15 – 60 are increasing the fastest
- The stages of epidemiologic transition
- Describe the change from when our demographics were determined by epidemics and famines to now, where out demographics are mostly determined by non-communicable diseases, like cancer and cardiovascular disease
- Pestilence and famine
- High mortality rate, wide swings in mortality rate due to pestilence and famine, little population growth, low life expectancy
- Receding pandemics
- Epidemics and infectious diseases become less frequent, non-communicable diseases begin to appear
- Degenerative and man-made diseases
- Mortality due to non-communicable and man-made diseases becomes higher than mortality due to infectious diseases and famine
34. Demographic indicators: measures of birth and fertility
- Crude birth rate – annual number of live births per 1000 people
- 18 live births per 1000 people (2017)
- Fertility rate – annual number of live births per woman of childbearing age (15 – 49)
- Around 5 live births per woman in Africa
- Around 1,5 live births per woman in Europe
- Age-specific fertility rates – annual number of live births per 1000 women in particular age groups
- 15 – 19
- 20 – 24
- etc.
- Natural balance = difference between births and deaths per 1000 people
- In some European countries the natural balance is negative = natural decrease
- -3,0 in Greece
- -4,0 in Hungary
- In most countries the natural balance is positive = natural increase
- 4,1 in Norway
- In some European countries the natural balance is negative = natural decrease
- Gross reproduction rate – annual number of daughters per 1000 women of childbearing age
- Net reproduction rate – annual number of daughters per 1000 newborn women
- The net reproduction rate is always lower than the gross reproduction rate, because some women die before entering their childbearing years
little tip,
for topic 14, it should be Katsusaburou, not Katsusabura (theres no such a name in japan :P)
I believe I got that straight from the lecture, so blame them!
Thanks, asian bitch <3
Are those notes mixed?? I’m looking for Epidemiology Notes specifically
So they’ve changed the topic list for ph 1 and 2 the later years. These notes follow the old topic list, because that’s the one that counts for those having public health final this year.