Table of Contents
Page created on October 24, 2018. Last updated on December 18, 2024 at 16:56
Right atrial enlargement
The right atrium is rarely hypertrophic. Pressure or volume load almost always causes dilatation and not hypertrophy.
Etiology:
- Pressure load on the atria
- Stenosis of the tricuspid or pulmonary valve
- COPD
- Chronic respiratory failure
- Right ventricular hypertrophy
- Volume load on the atria
- Insufficiency of the tricuspid or pulmonary valve
- Left-to-right shunts
- Left-sided heart failure
ECG morphology:
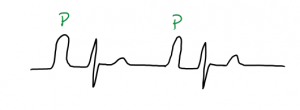
The morphology of the P wave during right atrial enlargement is called “pulmonary P“. The pulmonary P is mostly seen in inferior leads (II, III, aVF). It involves the following:
- Peaked, tall P wave
- In lead V1, the P-wave may be biphasic, where the first, positive part is bigger
The depolarization of the right atrium is responsible for the 1st part of the P wave.
Left atrial enlargement
Etiology:
- Mitral or aortic valve insufficiency
- Mitral or aortic valve stenosis
- Systemic hypertension
- Right-to-left shunt
- Cardiomyopathy
ECG morphology:
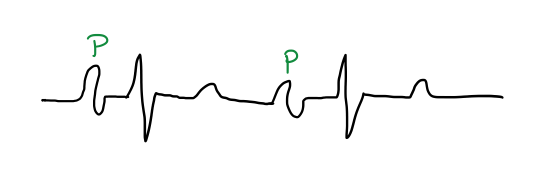
Two special P-wave morphologies are seen in left atrial enlargement:
- Mitral P
- Broad, split P wave in leads I, II, V5, V6
- P terminal force
- Biphasic P-wave in lead V1 where the second, negative part is bigger
The depolarization of the left atrium is responsible for the 2nd part of the P wave.
Biatrial enlargement
A combination of the causing factor of both right and left atria can lead to biatrial enlargement.
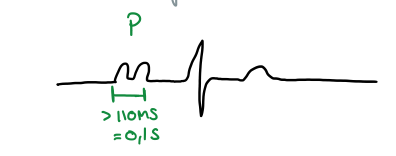
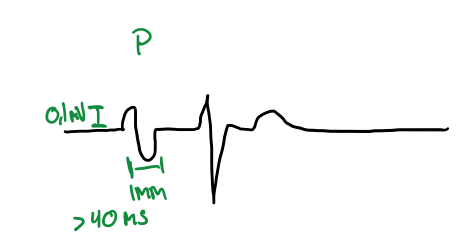
ECG morphology:
- A biatriale P-wave can be observed in II, III and aVF.
- It will be broad and high, more than 0,25 mV tall and more than 0,10 s broad!
- Biphasic P wave in V1 and V2.
- Both components of this biphasic P-wave exceed 0,1 mV
- Terminal negative component is longer than 0,04 s
Ventricular hypertrophy
Ventricular hypertrophy occurs due to long-term pressure or volume load on the ventricle.
The enlarged myocardium shifts the electrical axis toward the hypetrophic muscle. Depolarization of a big muscle takes longer, so the ventricular activation time (VAT) is prolonged. QRS will therefore be slightly widened (100 – 120 ms). Note that secondary repolarization abnormalities (ST-segment and T-wave) may be present as the ischemia often develops in a hypertrophied heart.
Right ventricular hypertrophy
Etiology:
- Pulmonary hypertension
ECG morphology:
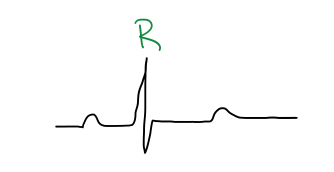
The chest leads V1 and V2 correspond to the right ventricle, so most of these signs are seen there.
- Enlarged R-wave (> 0.7 mV) – in V1 and V2
- VAT > 40 ms – in V1 and V2
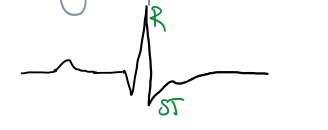
- ST-depression and T-wave inversion in V1 and V2
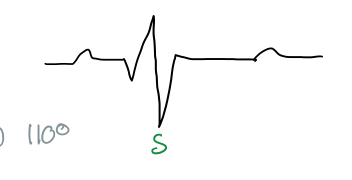
- Dominant and deep S-wave – in V5 and V6 (left ventricular leads)
Right axis deviation
Acute load on the right ventricle
Etiology:
- Pulmonary embolism
- Pneumothorax
ECG morphology:
- Sinus tachycardia
- Large R wave – in V1
- Large S wave – in lead I
- Large Q – in lead III
- Negative T – in lead III
Left ventricular hypertrophy
Etiology:
- Systemic hypertension
- Aortic stenosis
- Right-to-left shunt
- Cardiomyopathy
ECG morphology:
- Left axis deviation
- High voltage
- Positive Sokolow index: Sum of the amplitude of S wave in V1 and the amplitude of the R wave in V5 > 35 mm
- Positive Lewis index: Sum of the amplitude of S wave in III and the amplitude of the R wave in I > 25 mm
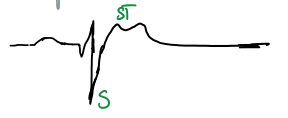
- Strain signs – in left ventricular leads (I, aVL, V4, V5, V6)
- Descending ST depression
- Negative T waves
- VAT > 40 ms – in leads V5, V6
“A biatriale P-wave can be observed in II, II and aVF.”
Is it only lead II and aVF we can observe it on?
Thanks 🙂
It’s II, III, aVF according to the book. Fixed.
hi, in LV hypertrophy, do we see deep s wave in v1 and v2 ?
Yes
How can we calculate the amplitude for high voltage?
The amplitude is the “height” of the waves above the baseline, whether pointing down or up. The amplitude is measured in millivolts (mV).
Thanks