Table of Contents
Page created on October 21, 2019. Last updated on January 24, 2022 at 16:07
The human electrocardiogram, often called ECG, measures the electrical activity of the heart over time using electrodes placed on specific parts of the body. This is possible because a small part of the electrical impulse produced by the heart spreads into all parts of the body, including the skin.
The cardiac impulse travels from the right atrium along the septum toward the apex of the heart, in a downward diagonal direction.
Characteristics of a normal ECG
A normal ECG is composed of a P wave, a QRS complex and a T wave. The QRS complex itself is comprised of three separate waves, the Q, R and the S wave.
ECG waves:
An ECG wave is either positive or negative. Positive waves point upwards while negative waves point downwards. Each wave corresponds to an electrical event in the cardiac cycle:
- The P wave – caused by potentials generated as the atria depolarize
- The QRS complex – caused by potentials generated as the ventricles depolarize
- The T wave – caused by potentials generated as the ventricles repolarize
The atrial repolarization doesn’t cause a wave on the ECG because it occurs simultaneously as the ventricular depolarization and is therefore “buried” in the QRS complex.
Sometimes a small positive wave can be seen after the T wave. This is called the U wave.
The T wave is negative in lead aVR.
ECG intervals and segments:
In addition to the waves some of the segments between the waves are important. The most important are:
- The PQ interval or PR interval – which begins at the beginning of the P wave and ends at the beginning of the QRS complex
- The ST segment – which begins at the end of the QRS complex and ends at the beginning of the T wave
- The QT interval – which begins at the beginning of the QRS complex and ends at the end of the T wave
- The RR interval – which begins at the R wave of one QRS complex and ends at the R wave of the QRS complex of the next heartbeat
In ECG terminology an interval is a period of time which includes a wave. A segment is a period of time which is between two waves and doesn’t include any waves.
The PQ interval corresponds to the time it takes for the impulse to travel from the atria to the ventricle. More specifically its length depends on the conduction velocity of the AV node, which can be regulated by the sympathetic and parasympathetic nervous systems.
The PQ interval is the baseline for the ECG; by definition the PQ interval is at the isoelectric line. The ST segment should be at the same level as the PQ interval.
The duration of the RR interval is the time between two heart beats. Logically, its duration depends on the heart rate. The faster the heart rate, the shorter the RR interval.
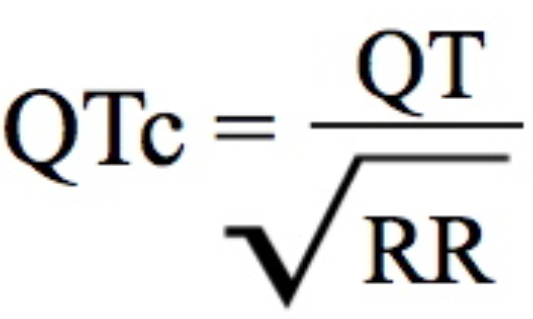
The duration of the QT interval is highly variable depending on the heart rate. To compare QT intervals between individuals we must correct for their heart rate. This allows us to compare QT intervals as if all individuals had the same heart rate. This corrected QT value is called QTc and can be calculated like this:
Normal values:
Each wave, interval and segment have normal values which are important.
|
Wave, interval or segment |
Normal length | Normal amplitude |
|
P wave |
< 0,1 sec | 0,2 mV |
|
PQ interval |
0,12 – 0,20 sec | – |
|
QRS complex |
< 0,1 sec | 0,5 – 1,5 mV |
| ST segment | – |
Isoelectric with PQ interval |
| T wave | – |
– |
| QT interval | 0,37 – 0,41 sec |
– |
| QTc | < 0,43 sec |
– |
ECG paper
ECGs are printed on a special paper which allows for precise measurement of the ECG. This paper is grid paper composed of small 1 mm x 1 mm squares, and larger 5 mm x 5 mm squares. 1 small square equals 0,04 seconds horizontally, and 1 big square equals 0,20 seconds.
1 small square vertically equals 0,1 mV. 1 big square equals 0,5 mV.
From the ECG below we can see that the T wave lasts for approximately 0,12 seconds and that its amplitude is approximately 0,3 mV.
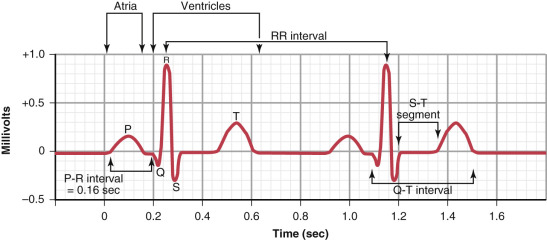
A normal ECG from lead II
ECG leads
The ECG is measured by putting 10 electrodes on specific places on the person. These electrodes allow us to examine the hearts electrical activity from 12 different “angles”, or explained differently, in 12 different “directions”. We call these angles or directions leads. We have three types of leads:
- Einthoven’s bipolar limb leads
- Leads I, II and III
- Wilson-Goldberger’s unipolar limb leads
- Leads aVR, aVF and aVL
- Precordial chest leads
- Leads V1, V2, V3, V4, V5 and V6
The limb leads examine the heart in the frontal plane while the chest leads examine heart in the horizontal plane.
Einthoven’s bipolar limb leads:
Often called just bipolar limb leads, these leads are measured by the use of four electrodes, one for each limb. The electrode for the right leg is grounded/earthed and is therefore not directly used in the measurement.
Lead I compares the electrode on the right arm with the one on the left arm. Lead I examines the electrical activity of the heart in the horizontal direction, from right to left.
Lead II compares the electrode on the right arm with the one on the left leg. Lead II examines the electrical activity of the heart diagonally, from the right arm to the left leg. Lead II is the lead which most closely measures the electrical activity of the heart along the septum of the heart, which is why it’s the most representative of the electrical activity of the heart.
Lead III compares the electrode on the left arm with the one on the left leg. Lead III examines the electrical activity of the heart diagonally, from the left arm to the left leg.
Wilson-Goldberger’s unipolar limb leads:
The unipolar limb leads don’t compare the electrical activity of two electrodes, as the name suggests. Instead, the ECG measuring machine calculates a “virtual” electrode in the middle of the body called Wilson’s central terminal. The machine then compares the right arm, left arm and left leg electrodes to the Wilson’s central terminal.
Lead aVF compares Wilson’s central terminal with the electrode on the left leg. It examines the heart in a vertical line from the middle of the body toward the left leg.
Lead aVL compares Wilson’s central terminal with the electrode on the left arm. It examines the heart in a diagonal line from the middle of the body toward the left arm.
Lead aVR compares Wilson’s central terminal with the electrode on the right arm. It examines the heart in a diagonal line from the middle of the body toward the right arm.
F, L and R stand for foot, left arm and right arm. aV stands for augmented vector.
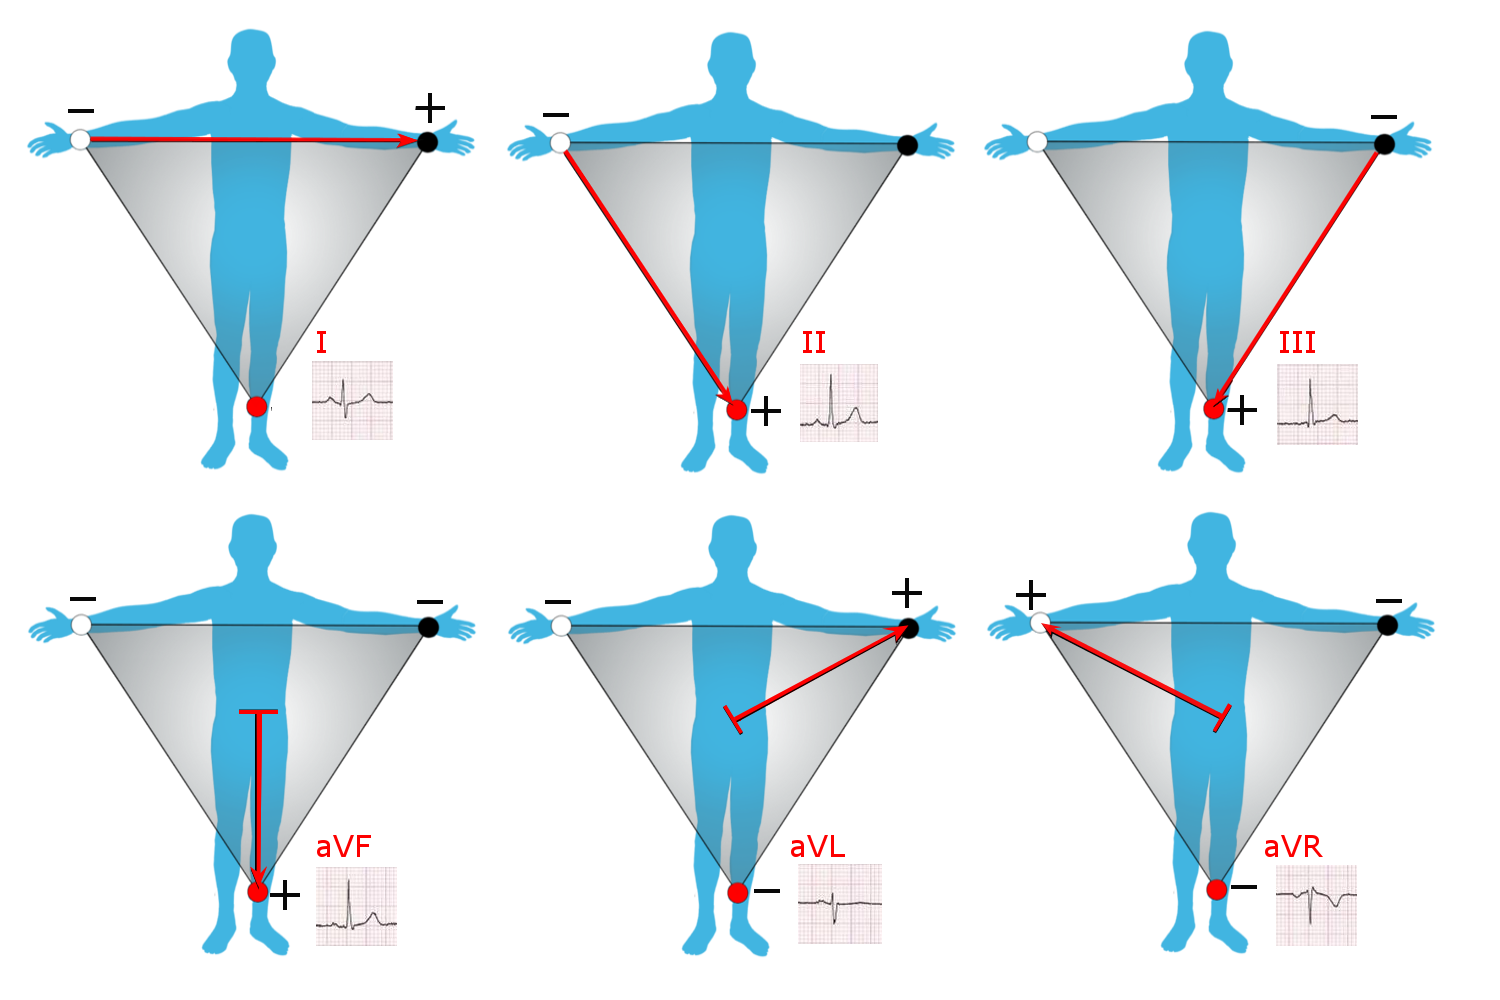
Limb leads. See how all limb leads examine the heart in the frontal plane, and how each lead examines the heart in a different reaction.
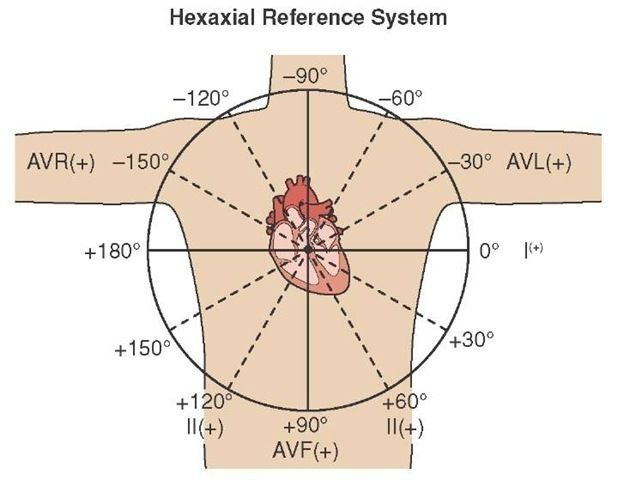
Limb leads. Here you can see which angles the different leads examine the heart in.
Precordial chest leads:
While the limb leads examine the heart in the frontal plane, the chest leads examine the heart in the horizontal plane. The six electrodes for these leads are attached to different places on the chest instead of the limbs. They’re “precordial” because they’re in front of the heart.
The six electrodes must be attached to specific places on the chest:
|
Electrode |
Vertical position | Horizontal position |
|
V1 |
In the 4th intercostal space | Parasternal, right side |
|
V2 |
In the 4th intercostal space | Parasternal, left side |
|
V3 |
Between electrodes V2 and V4 |
|
| V4 | In the 5th intercostal space |
Mid-clavicular line, left side |
| V5 | In the 5th intercostal space |
Anterior axillary line, left side |
| V6 | In the 5th intercostal space |
Mid-axillary line, left side |
Lead V1 to V6 examine the heart in the direction from the middle of the body and to the individual electrodes, as seen on the picture below.
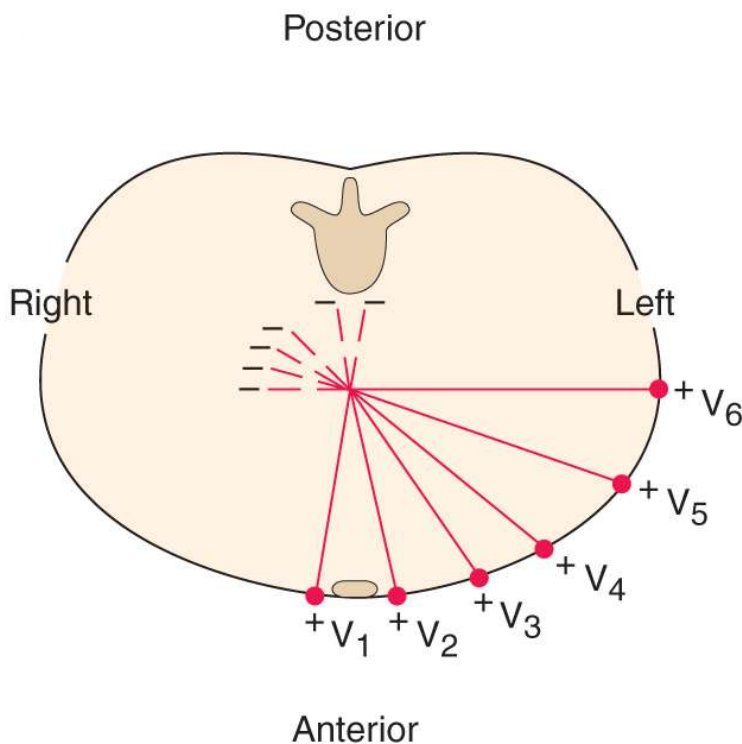
Leads V1 to V6. This image is a cross-section of the body at the level of the heart, seen from below.
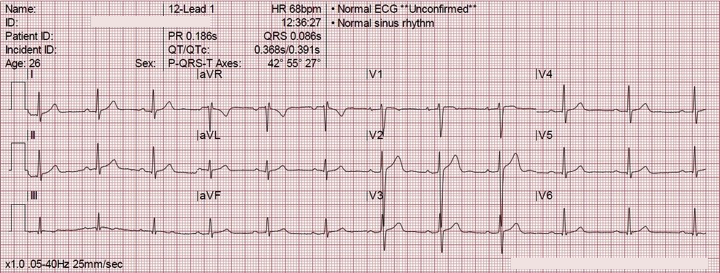
The 12 lead ECG:
3 and 3 leads are usually measured simultaneously, and all the 12 leads are shown together on a piece of ECG paper. As you can see from the below ECG the waves look different in different leads. Lead II is the one which is usually used as an example ECG.
AV block
Atrioventricular block (AV block) or heart block refers to a disturbance in the conductance between the atria and the ventricles. Something causes this conduction to be slower than normal or even completely stopped.
There are four types of AV block, depending on the severity of the conduction disturbance:
- 1st degree AV block
- 2nd degree AV block
- 2nd degree AV block Mobitz type 1 (Wenckebach)
- 2nd degree AV block Mobitz type 2
- 3rd degree AV block / complete AV block
1st degree AV block:
First degree AV block is defined as a prolonged PQ interval (> 200 ms). It’s usually harmless.
2nd degree AV block Mobitz type 1 (Wenckebach):
There are two types of second-degree AV block. The first one is called Mobitz type 1 or Wenckebach. An ECG with Wenckebach will show that the PQ interval becomes longer and longer with each heartbeat, until one atrial impulse doesn’t reach the ventricles (a P wave isn’t followed by a QRS complex).
2nd degree AV block Mobitz type 2:
This is the second type of second-degree AV block. An ECG with Mobitz type 2 will show that only every second or every third impulse from the atria is conducted to the ventricles, i.e. only every second or every third P wave is followed by a QRS complex.
3rd degree AV block:
In 3rd degree AV there is no conduction between the atria and the ventricles. The atria and ventricles will beat with different rhythms, completely dissociated from each other. The SA node will continue to send impulses to the atria, causing them to contract, but none of these will be conducted to the ventricles.
Because the ventricles don’t receive any impulses a backup pacemaker distally to the site of the AV block will take over the generation of the impulses. This backup pacemaker is usually in the distal parts of the AV node or in the His bundle.