Table of Contents
Page created on October 22, 2018. Last updated on May 22, 2020 at 13:59
Summary
Respiratory function tests like the full-body plethysmography can be used to measure dynamic and static lung volumes and airflow rates. These tests can be used to diagnose pulmonary disorders and differentiate between obstructive and restrictive lung diseases.
In obstructive disorders the dynamic parameters are often abnormal. Decreased Tiffeneau index and problems exhaling are characteristic.
In restrictive disorders the static parameters are often abnormal. Normal Tiffeneau index and problems inhaling are characteristic.
Diffusion analysis gives information of how efficiently oxygen diffuses across the alveolo-capillary membrane. It can be used to diagnose pulmonary fibrosis, emphysema or pulmonary hypertension.
Introduction
Respiratory function tests provide information about ventilation and about the gas exchange. They have a variety of uses:
- Diagnosis of dyspnoea
- Differentiation of restrictive and obstructive respiratory disorders
- Preoperative assessment of operational risk
- Judge effect of medications
- Evaluate functional state of the patient
- Screening
- Monitor deterioration of respiratory function
Analysis of ventilation
Ventilation is measured by a technique called open-system whole body plethysmography. A plethysmograph is a large airtight “box” that the patient will sit inside. Inside the box is a mouthpiece that the patient can breathe through, and a machine will measure the flow of the air. At first will the patient breathe normally through the mouthpiece, and afterward the patient will be asked to pant and breathe fully in and out. The machine calculates the airway resistance and lung volumes by using math based on how the volume and pressure inside the airtight box changes when the patient breathes.
The plethysmograph measures static and dynamic parameters, estimates volume/flow curves, the airway resistance and the compliance. The normal values vary depending on gender, age and body height, but the computer will calculate these for us. The measured values are compared to these normal values and expressed both in absolute numbers and as a percentage (%) of the normal values.
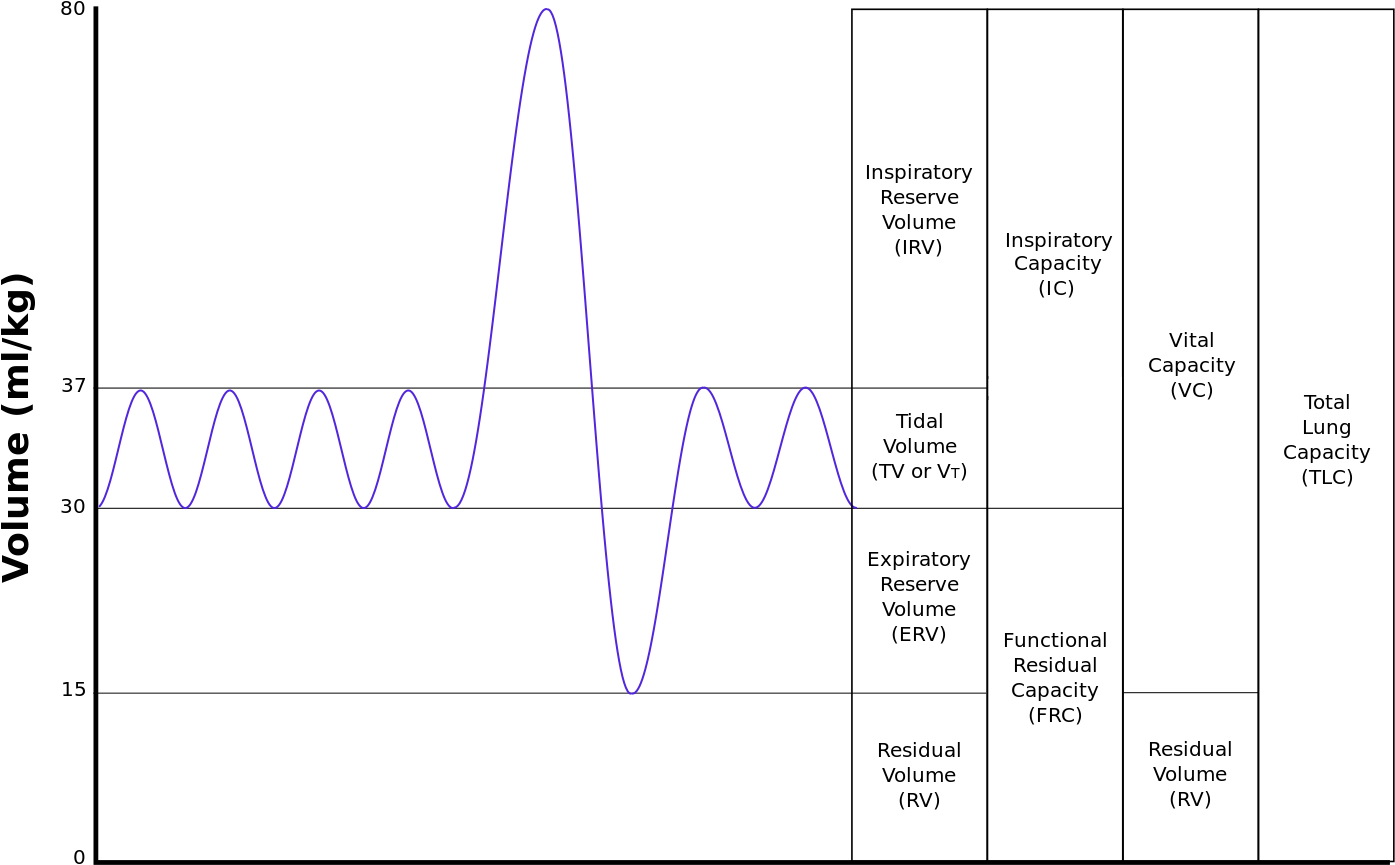
The static parameters are not time-dependent. They are usually abnormal in restrictive lung disorders. The static parameters are:
| Parameter | Abbreviation | Characteristic | Normal range | Calculation |
| Tidal volume | VT or TV | The amount of inspired air with a normal breath | 500-600 mL | |
| Inspiratory reserve volume | IRV | The maximal amount of air that can be inspired after a normal inspiration | Ca. 2500 mL | |
| Expiratory reserve volume | ERV | The maximal amount of air that can be expired after a normal expiration | Ca. 1000 mL | |
| Residual volume | RV | The amount of air remaining in the lung after maximal expiration | ||
| Vital capacity | VC | The maximum amount of air that can be moved voluntarily | [IRV + VT + ERV] or [TLC – RV] | |
| Total lung capacity | TLC | The total air content of the lung after maximal inspiration | [VC + RV] | |
| Inspiratory capacity | IC | The amount of air that can be inspired after a normal expiration | [VT + IRV] | |
| Functional residual capacity | FRC | The amount of air remaining in the lung after a normal expiration | [RV + ERV] |
The dynamic parameters depend on time. They are usually abnormal in obstructive lung disorders. The dynamic parameters are:
| Parameter | Abbreviation | Characteristic | Normal range |
| Forced expiratory capacity (forced vital capacity | FVC | The amount of air that can be expired after a maximum inspiration. | Normally equal to VC, in airway obstruction it is much smaller |
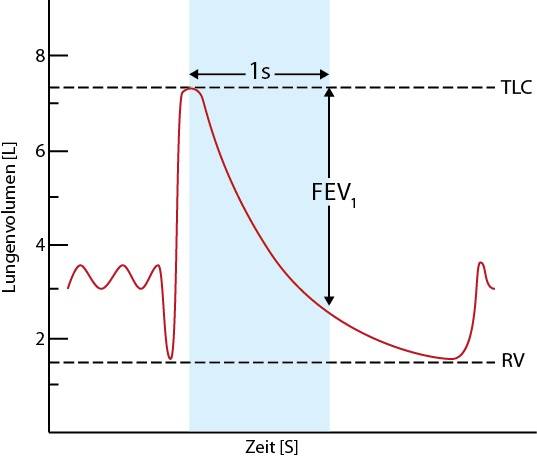
| Forced expiratory volume | FEV1 | The volume of air that can be expired within one second after a maximum inspiration | |
| Tiffeneau index | FEV1% | The FEV1/VC ratio. It shows whether the decrease in FEV1 and VC is proportional. Used to differentiate obstructive and restrictive disorders. | Decreased index suggests obstructive disease |
| Forced inspiratory volume | FIV1 | The volume of air that can be inspired within one second after a maximum expiration | Greater than FEV1. |
| Peak expiratory flow | PEF | The maximum flow speed of air on exhalation | Decreased in obstructive disease |
The flow-volume curve has important diagnostic value. It shows how fast the patient can exhale air. This air flow speed is different depending on how much air is left in the lung. The less air is in the lung, the lower is the speed of the exhaled remaining air.
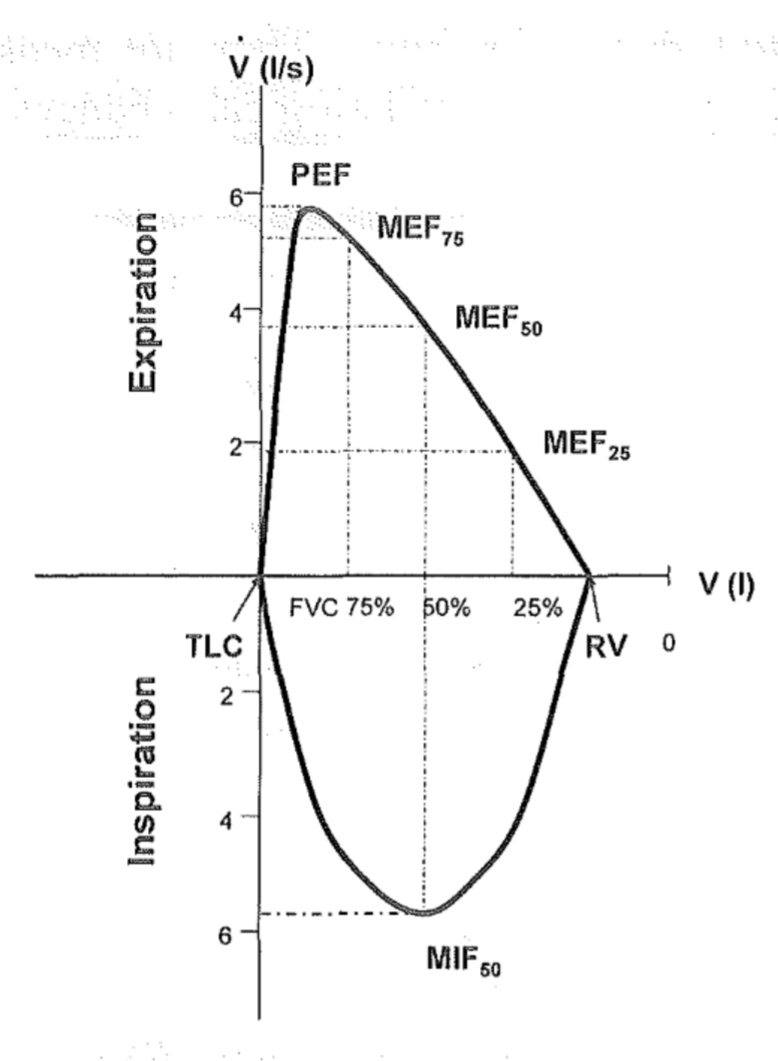
The y-axis on the curve is the flow speed while the x axis shows the remaining volume in the lung. Note that at origo the lungs are full of air (TLC) and when we go to the right on the x axis the lung volume gets smaller and smaller until the remaining air in the lung equals the residual volume.
From the graph you can see that the air flow speed is at its highest when the lung is almost full. This maximum speed is called the peak expiratory flow, PEF. Then, the air flow speed gets lower and lower as the air volume in the lungs gets smaller and smaller. The air flow speed when the lung is at 75% full capacity is called MEF75, the speed when the lung is at 50% capacity is called MEF50 and so on.
Airway resistance (Raw) is also measured by a plethysmograph. Airway resistance shows how much the pressure inside the alveoli must be increased to increase the air flow speed. If airway resistance is high, then a very high pressure inside the alveoli is needed to increase the air flow speed. The air flow speed won’t increase much unless the pressure inside the alveoli is very high. If airway resistance is normal, then will the air flow speed increase even with a small increase in alveolar pressure, which is good.
A normal airway resistance is below 300 Pa per litre per second (0.3 kPa/L/s). When the airways become narrower the airway resistance increases and vice versa. The diameter of the large airways has the biggest influence on the airway resistance, i.e. if the big airways become narrower the airway resistance increases significantly, but if the small airways become narrower the airway resistance doesn’t really change much. This is because the small airways only account for 10-20% of the total airway resistance.
The last ventilation parameter is the compliance. We can think of compliance as how “easy” the lung can expand. When the lung is rigid, like in fibrosis, the lung has a hard time expanding, so the compliance is decreased.
We measure compliance as how much air the lung can distend when the pressure inside the lung changes. If the lung can distend a lot when the pressure increases, then the compliance is high, which is good. If the lung just distends a little when the pressure increases by the same amount, then the compliance is low, which is bad.
Compliance is measured in litres per kilopascal (pascal is a measure of pressure). The normal lung compliance is 2 L/kPa, meaning that a 1 kPa change in pressure causes the lung to gain 2 litres of air.
Evaluation of ventilation parameters
We must evaluate the obtained parameters to see whether they’re abnormal and to settle on a diagnosis. We must also determine whether it is a restrictive or obstructive lung disease, and we must determine the severity.
Restrictive respiratory disorders
Restrictive respiratory are characterised by the inability of the lung to expand properly, often due to decreased compliance.
It can occur due to:
- Intrinsic causes
- Interstitial lung disease
- Sarcoidosis
- Pulmonary fibrosis
- Pneumoconioses
- Pneumonia
- Pulmonary oedema
- Pulmonary congestion
- Interstitial lung disease
- Extrinsic causes
- Pleural effusion
- Pneumothorax
- Kyphoscoliosis
- Obesity
In restrictive respiratory disorders the following parameters will be changed:
- Decrease in static volumes
- VC ↓
- TLC ↓
- RV ↓
- FRC ↓
- Decrease in dynamic volumes
- FVC ↓
- FEV1 ↓
- Tiffeneau index normal or even elevated
- Normal because FVC and FEV1 decrease by the same degree
- Elevated if FVC decreases by more than FEV1
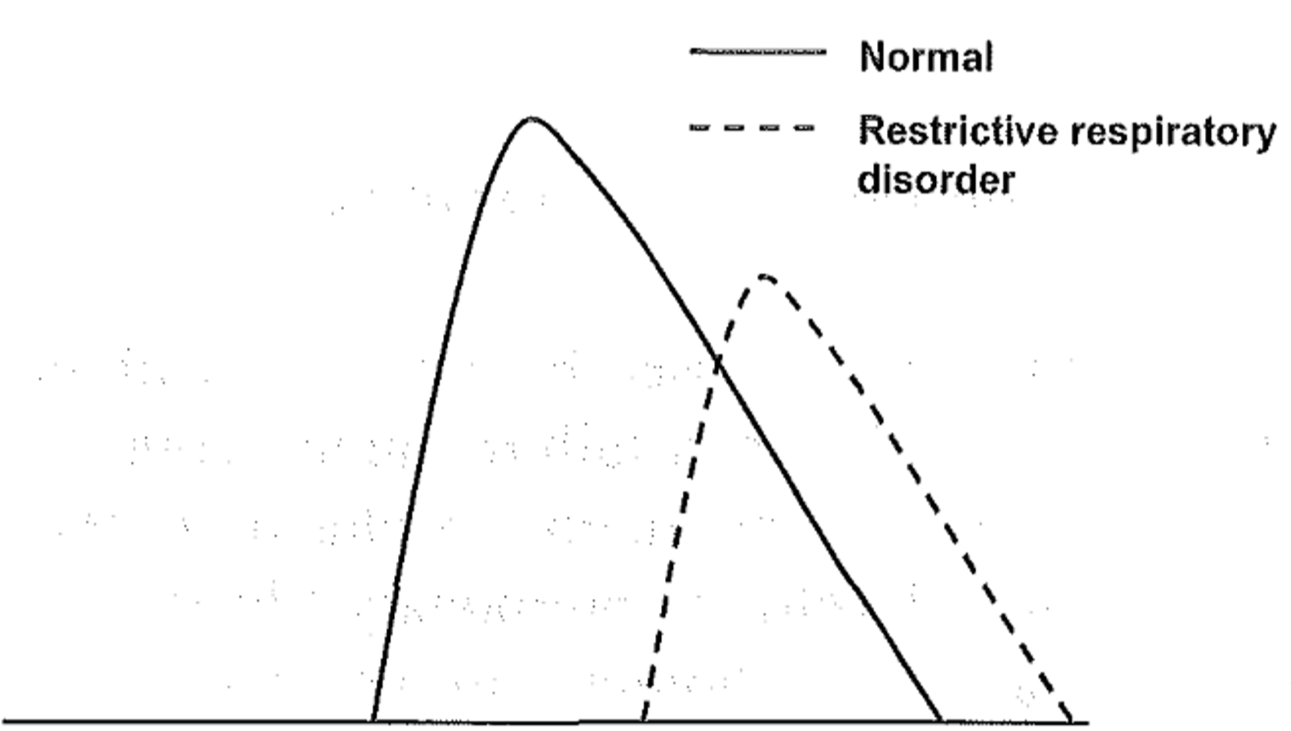
In restrictive respiratory disorders the flow-volume curve is similar to the normal just smaller. The residual volume (the point where the curve’s right leg meets the x-axis is closer to 0) is decreased and the PEF (the height of the top of the curve) is decreased. The different MEFs are also decreased compared to normal.
Obstructive respiratory disorders
Obstructive disorders are caused by a narrowing of the bronchial system. This narrowing can be either endobronchial or exobronchial.
Endobronchial obstruction is caused by:
- Bronchial asthma
- Chronic bronchitis
In endobronchial obstruction we see the following:
- FEV1 ↓
- FRC ↑
- Tiffeneau index ↓
- Airway resistance ↑
Exobronchial obstruction is caused by emphysema. In emphysema the elastic fibres of the lung are lost, so they can’t hold the bronchi open during expiration. This causes the bronchi to collapse during expiration. We can see the following changes:
- FEV1 ↓
- Tiffeneau index ↓
- FVC ↓
- FRC ↑
- Caused by air being trapped in the bronchi due to bronchial collapse
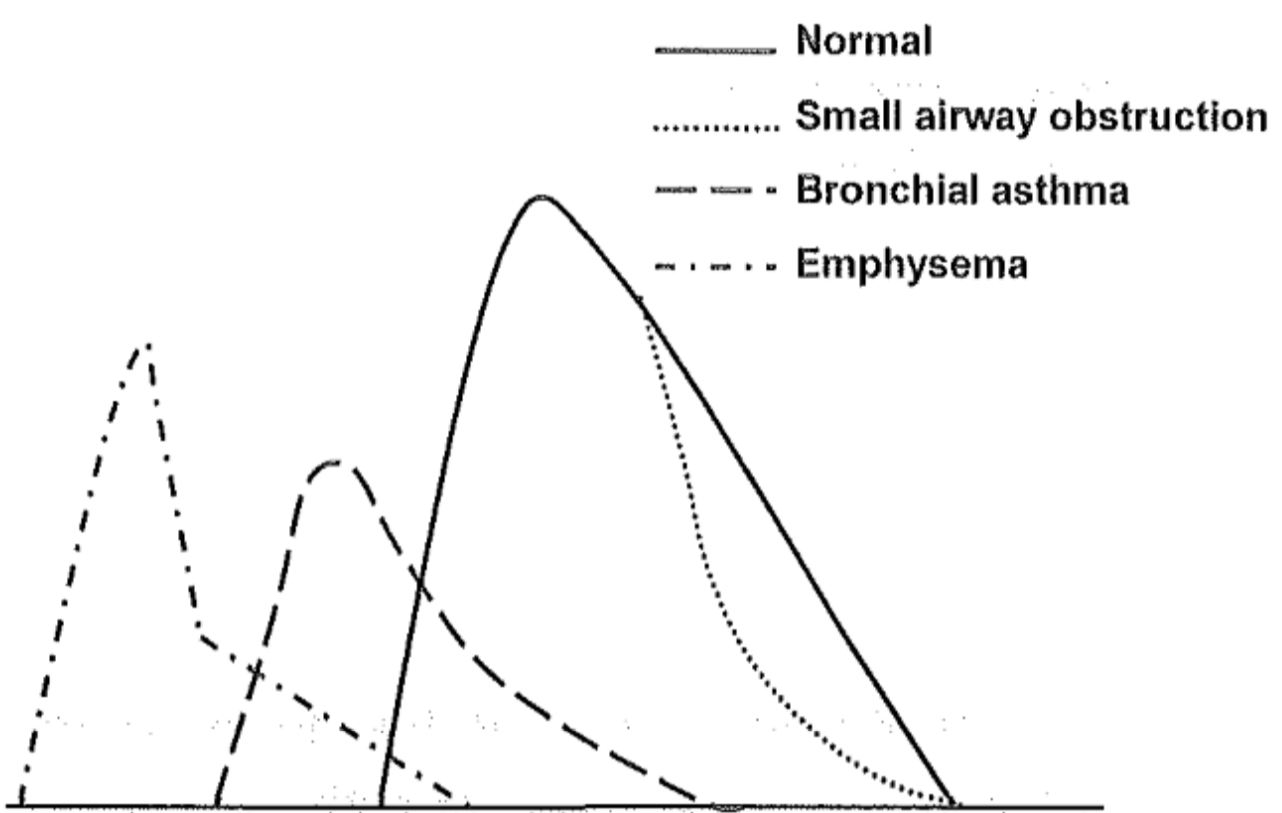
The flow-volume curve in obstructive disorders differ depending on the reason for the obstruction. When the small airways are obstructed only the MEF25 and MEF50 are decreased, the rest is normal. In bronchial asthma the obstruction of the big airways causes a decrease in PEF and different MEFs, while the RV increases. In emphysema RV increases even more, due to the bronchi closing which leaves a large amount of air trapped in the airways. The “broken” right leg of the emphysema flow-volume curve is very characteristic for emphysema.
Extra and intra-thoracic airway obstruction
Airways may be obstructed either due to things outside the thorax or inside it.
Extrathoracic airway obstruction may be caused by laryngeal tumour, large goiter or oedema of the vocal cords called Reinke-oedema. The flow-volume curve of extrathoracic airway obstruction looks like this:
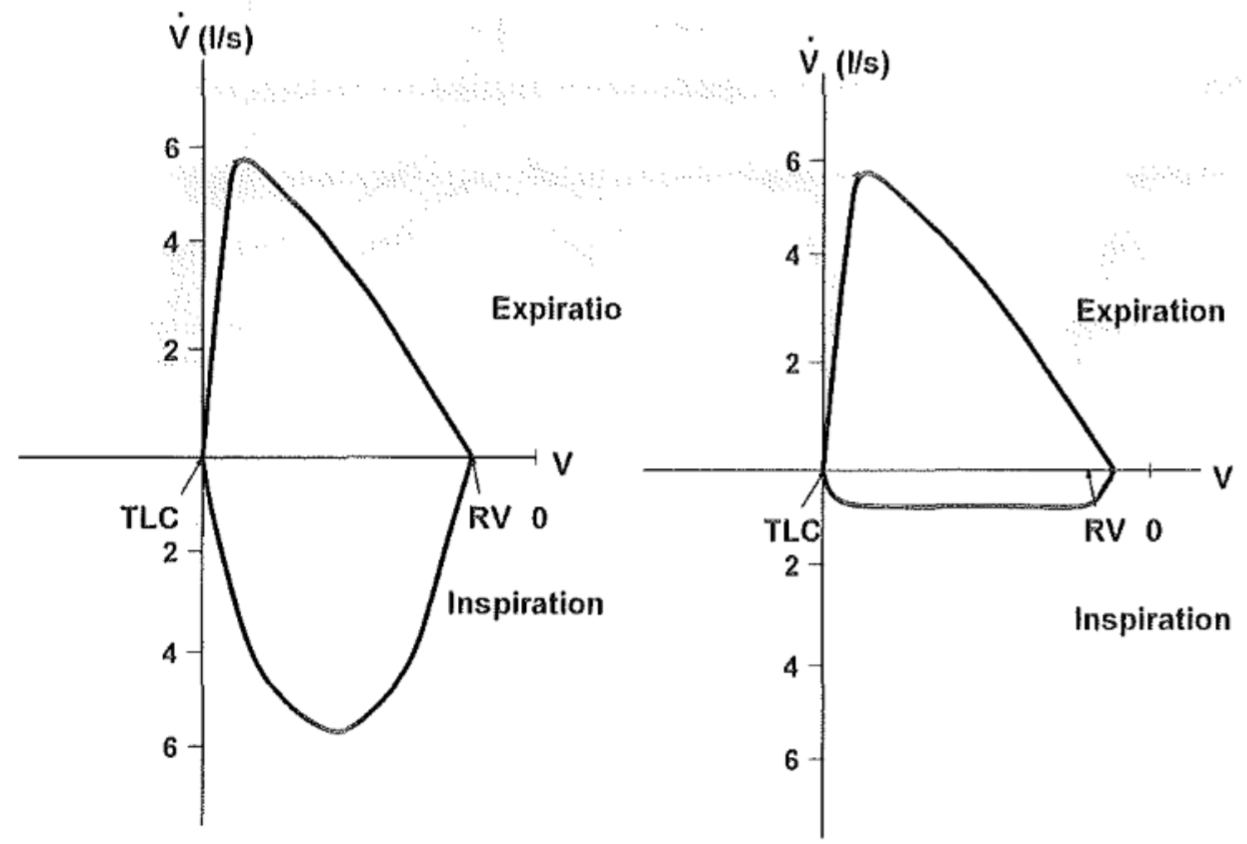
It’s easy to see that there’s something wrong with the inspiration. When there is no air inside the airways will the atmospheric pressure cause compression of the airways, which is added to the existing extrathoracic obstruction. The extra narrow airways make it hard to inspire, while expiration is mostly normal.
- FEV1 > FIV1
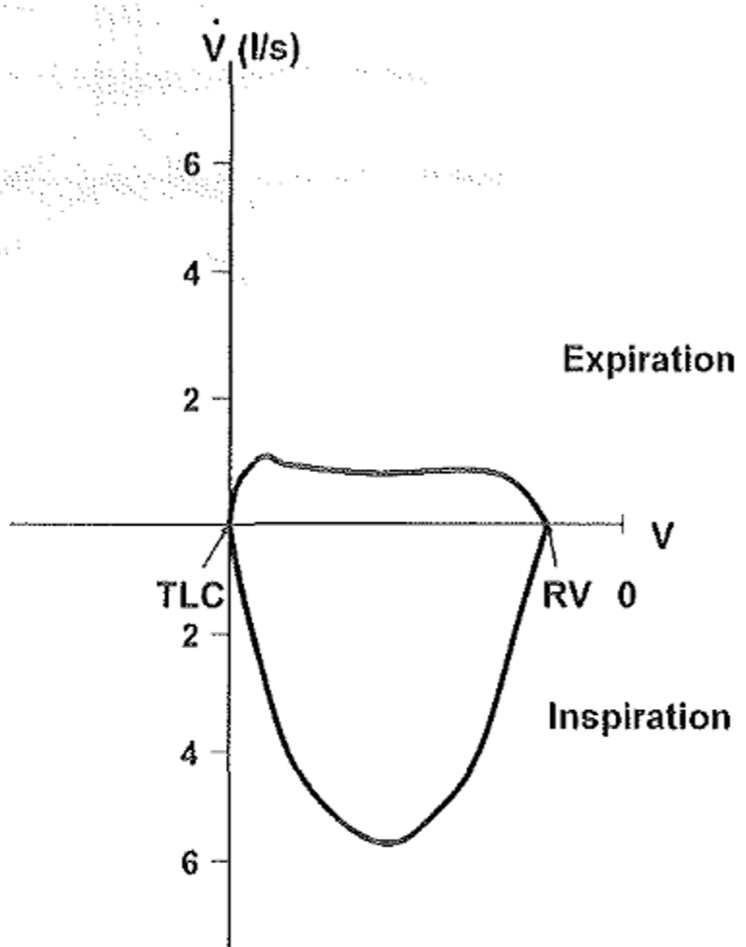
In an intrathoracic obstruction (like due to a tracheal tumour) expiration will be difficult, while inspiration is normal. It looks like this:
This topic is very long already; however we still have to discuss the analysis and evaluation of diffusion.
Analysis of diffusion
Diffusion analysis provides information about the diffusion of oxygen from the alveolar air to the red blood cells and the diffusion of CO2 in the opposite direction.
It’s usually measured by the patient breathing in a mixture of 0.3 % carbon monoxide (CO) and 10 % helium (He) after a full expiration. They will then keep this mixture in their lungs for 10 seconds and then slowly exhale.
The content of CO and He in the exhaled air is measured. While the mixture is kept in the lungs will CO diffuse across the blood-air membrane while He does not. The CO in the exhaled air should be much lower than 0.3 %, due to diffusion and binding to haemoglobin. CO also diffuses into the residual volume of air in the lung. The amount of CO that diffuses into the RV can be measured by the dilution of He, because He doesn’t diffuse across the membrane. We can therefore calculate how much CO diffused over the alveolo-capillary membrane.
We can calculate the diffusion capacity, which is the gas volume that can diffuse from the alveoli into the pulmonary capillaries in one minute. The diffusion capacity is decreased in:
- Emphysema
- Due to destroyed blood-air membrane
- Pulmonary fibrosis
- Due to thickening of the blood-air membrane
The diffusion coefficient shows the diffusion per 1 litre of pulmonary volume. It is decreased in emphysema due to the membrane damage, while it is normal in patients that have removed parts of the lung.
hey greek.doctor
in exobronchial obustruuction paragraph:
;We can see the following changes:
FEV1 ↓
Tiffeneau index ↓
FVC ↓ ;
obstructive disorder , decrease the FEV1% that,s the truth . i just want to make sure that why if we have both decrease in FVC and FEV1 , FEV1% is not normal based on calculation?
thanks.
The FEV1 and the FVC does not decrease equally. Since the FEV1% decrease more the Tiffenau index decrease.
hey buddy , just wanted to say in Summary u mentioned vise versa about obstructive and restrictive as you mentioned correctly below
obstructive => abnormal dynamic parameters….
Thanks! Fixed now.
God bless you for this. It was painful to read, I can only imagine how painful it was to write it.
Thank you!
Yes, it’s one of the worst topics I’ve had to write, although in retrospect I think I wrote too much.